Cost Per Lead: How to Calculate It, and Why What You Count Decides the Number
Your figure is only as good as what you counted. Get the formula right, then settle what a lead is before you compare it to anyone else's.


/ On this page8 sections
Cost per lead is your marketing spend divided by the number of leads it produced. The formula is settled; the divisor is not.
Count a newsletter signup as a lead and your number comes out low. Count only someone who agreed to talk to a salesperson and, on identical spend, it comes out high.
Until you write down which one you mean, your cost per lead cannot be compared with anybody else's, including the benchmark table you were about to check it against.
What Cost Per Lead Measures
Cost per lead measures how much you paid for one expression of interest in what you sell. It is an average, not a price list: it tells you what the next lead is likely to cost. Lead cost means the same thing.
The word carries a second sense worth separating before anything else. Cost per lead is also a way of buying media, not only a way of reporting on it.
Bought that way, you pay per lead and nothing else. The charge lands only when a qualifying sign-up arrives, whatever the impressions and clicks it took.
The Reporting Sense and the Buying Sense
The reporting sense is arithmetic you do after the money is spent. You already have the spend and you already have the leads. The number tells you the average.
The buying sense is a price you agree in advance. A publisher delivers leads and invoices you per lead, so the contract has to say what a lead is before the first one arrives.
Both senses are in use, and mixing them causes real confusion. A benchmark drawn from advertising platforms answers the first question and tells you nothing about the second.
How to Calculate Cost Per Lead
To calculate cost per lead, add up everything the campaign cost and divide by the number of leads it brought in. That is the whole formula. Nobody argues about it.
Both terms need a definition before the division means anything. The cost side is the easier of the two, and it is still the one that gets undercounted.
What Belongs in the Numerator
Your numerator is every cost that had to be paid for those leads to exist. Ad spend, creative production, software subscriptions and agency fees all belong in it.
Two costs get left out most often, and both are large. The first is the time your own team spent making and running the campaign.
The second is the work of qualifying what arrived. Somebody has to research the lead, call them, and get in the door with a prospect who has a need. Jeff Josephson put that cost where it belongs in Brilliant Results, November 2013.
"The cost of doing so needs to be included in the cost of the lead, not in the cost of selling."
Leave those two out and the number flatters you. Put them in and it becomes something you can act on.
A Worked Two-Channel Example
Here is the arithmetic with every assumption printed, from Wall Street Prep's May 2022 illustration for a B2B startup. It runs two channels side by side.
Paid search spent $4,500 and brought 1,200 clicks at a 3.75% clicks-to-lead rate, which is 45 leads at $100.00 each. Content spent $12,000 against 8,000 visitors at a 5.00% rate, which is 400 leads at $30.00 each.
It also states its divisor, which is what makes the bottom row portable: a form fill plus consent to a sales call.
Those inputs give this table.
| Input | Paid search | Content |
|---|---|---|
| Spend | $4,500 | $12,000 |
| Traffic | 1,200 clicks | 8,000 visitors |
| Conversion to lead | 3.75% | 5.00% |
| Leads | 45 | 400 |
| Cost per lead | $100.00 | $30.00 |
Copy that shape and fill your own row. The moment the two columns use different definitions of a lead, the bottom row stops being a comparison.
What Counts as a Lead, and Why the Answer Changes the Number
What counts as a lead is a decision you make, not a fact you look up. It moves your number further than any bidding change will, and nobody else can make it for you.
The published definitions point at different actions, so the choice lands on your desk whether you want it or not.
Make it once, write it down, and the rest of the metric starts working.
Five Definitions of a Lead, and Five Different Numbers
Five publishers state what makes something a lead. Set side by side, they set the bar in five different places.
| Who | What that page counts as a lead |
|---|---|
| Klipfolio | A person who has expressed interest by filling out a form, subscribing to a newsletter, or downloading a resource |
| AppsFlyer | A potential customer who has taken an action indicating a likely purchase, such as creating an account, requesting information, or adding items to a shopping cart |
| First Page Sage | A direct connection by e-mail, phone or in-person introduction to a prospective customer interested in purchasing |
| Wall Street Prep | A user who fills out a form requesting more information and agrees to be contacted by a sales representative |
| Wikipedia | Typically the contact information of a consumer who has expressed interest in the advertiser's product or service |
Each cell is that publisher's own definition, shortened to fit the column.
A newsletter subscription and an in-person introduction are not the same event. A business counting the first reports a far lower cost per lead than one counting the second, on identical spend.
None of the five is wrong. They answer different questions. Each number is meaningful only beside the definition that produced it.
The Same Four Channels, Ranked Two Ways
A campaign can hand you an impression, a click, an inquiry, an attendee, a referral, an email address or a confirmed appointment. None of those is a lead until you say it is.
Which one you pick changes what the campaign appears to have cost. Those things "all drop you off in a different place in the sell-cycle, and so they all have different value", as Josephson wrote in that same November 2013 piece.
So settle the divisor first. To compare across strategies, in his words, "you need to agree on a common denominator: a standard definition of a sales lead".
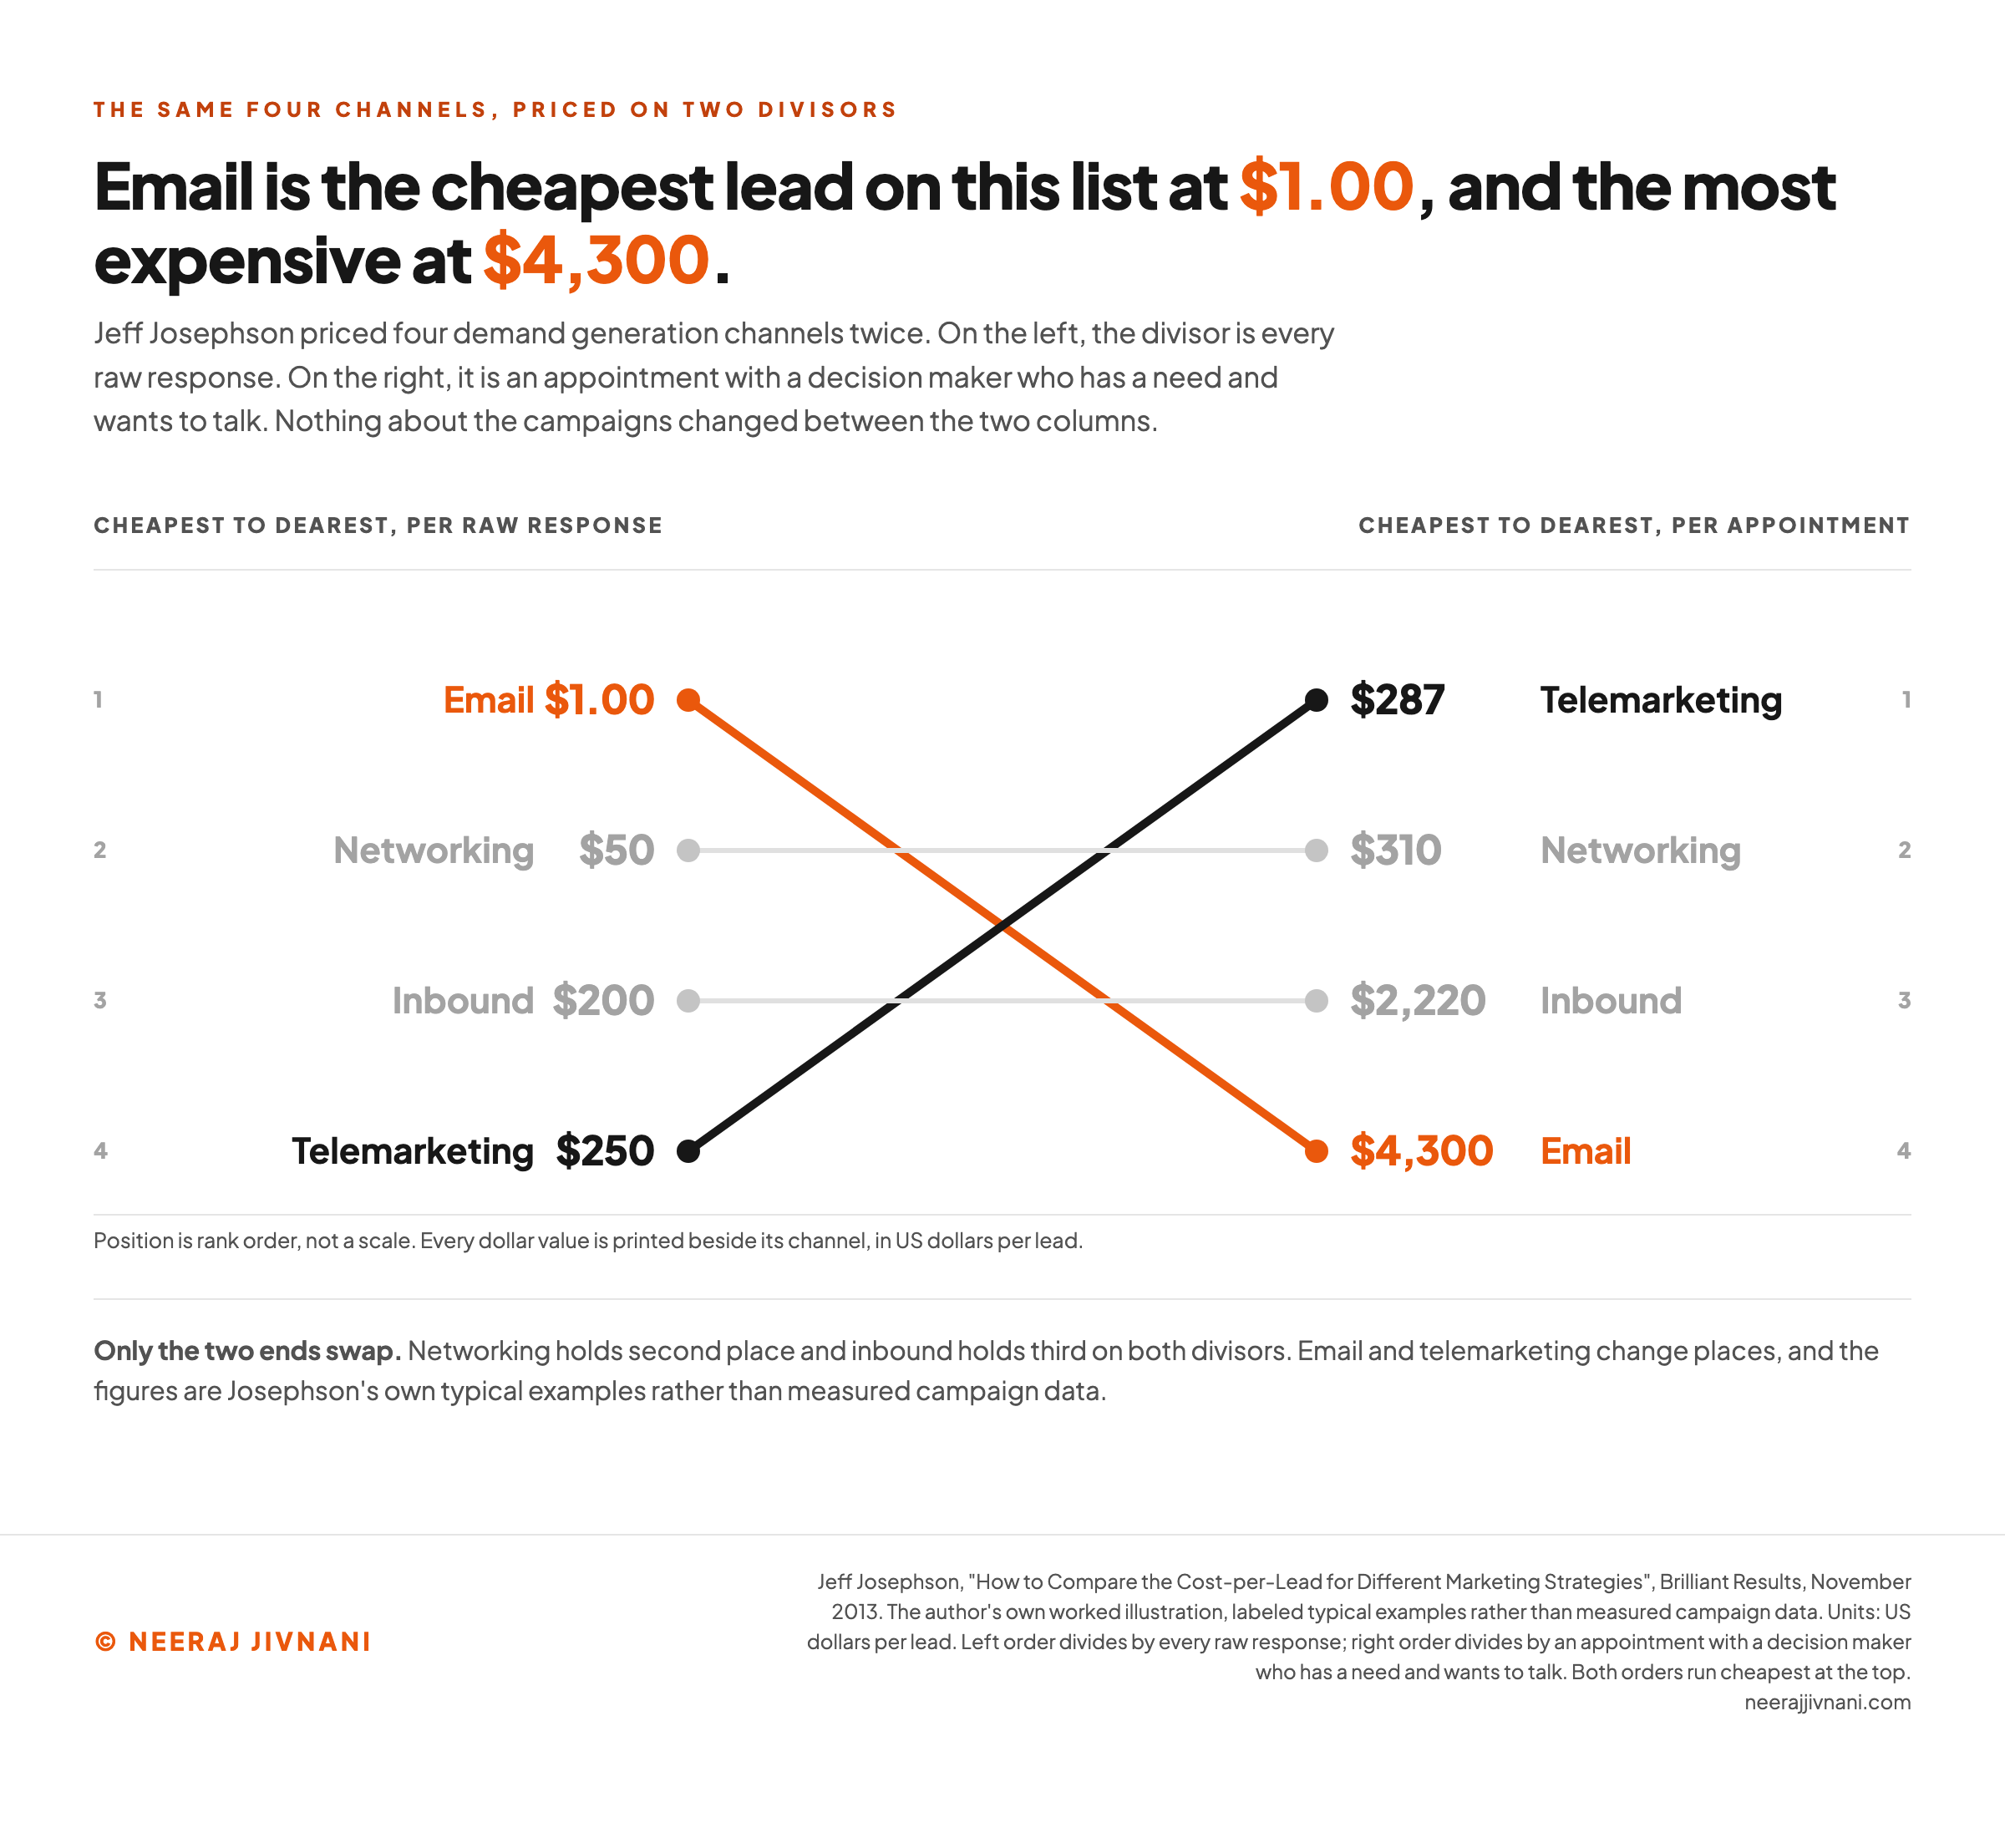
He priced four demand generation channels on two different divisors: every raw response, and an appointment with a decision maker who has a need and wants to talk.
| Channel | Cost per unqualified lead | Cost per qualified lead |
|---|---|---|
| $1.00 | $4,300 | |
| Networking | $50 | $310 |
| Inbound | $200 | $2,220 |
| Telemarketing | $250 | $287 |
The cheapest channel and the most expensive one change places. Email is the bargain in the left column and the worst buy in the right. Telemarketing does the reverse.
Nothing about the campaigns changed between those two columns. The only thing that moved is what he agreed to count.
His figures are a worked illustration rather than measured campaign data, and he labels them typical examples.
What they carry is structural: a ranking built on raw responses can reverse as soon as the qualification step is priced into the lead instead of into the sale.
One Budget, Several Different Costs Per Lead
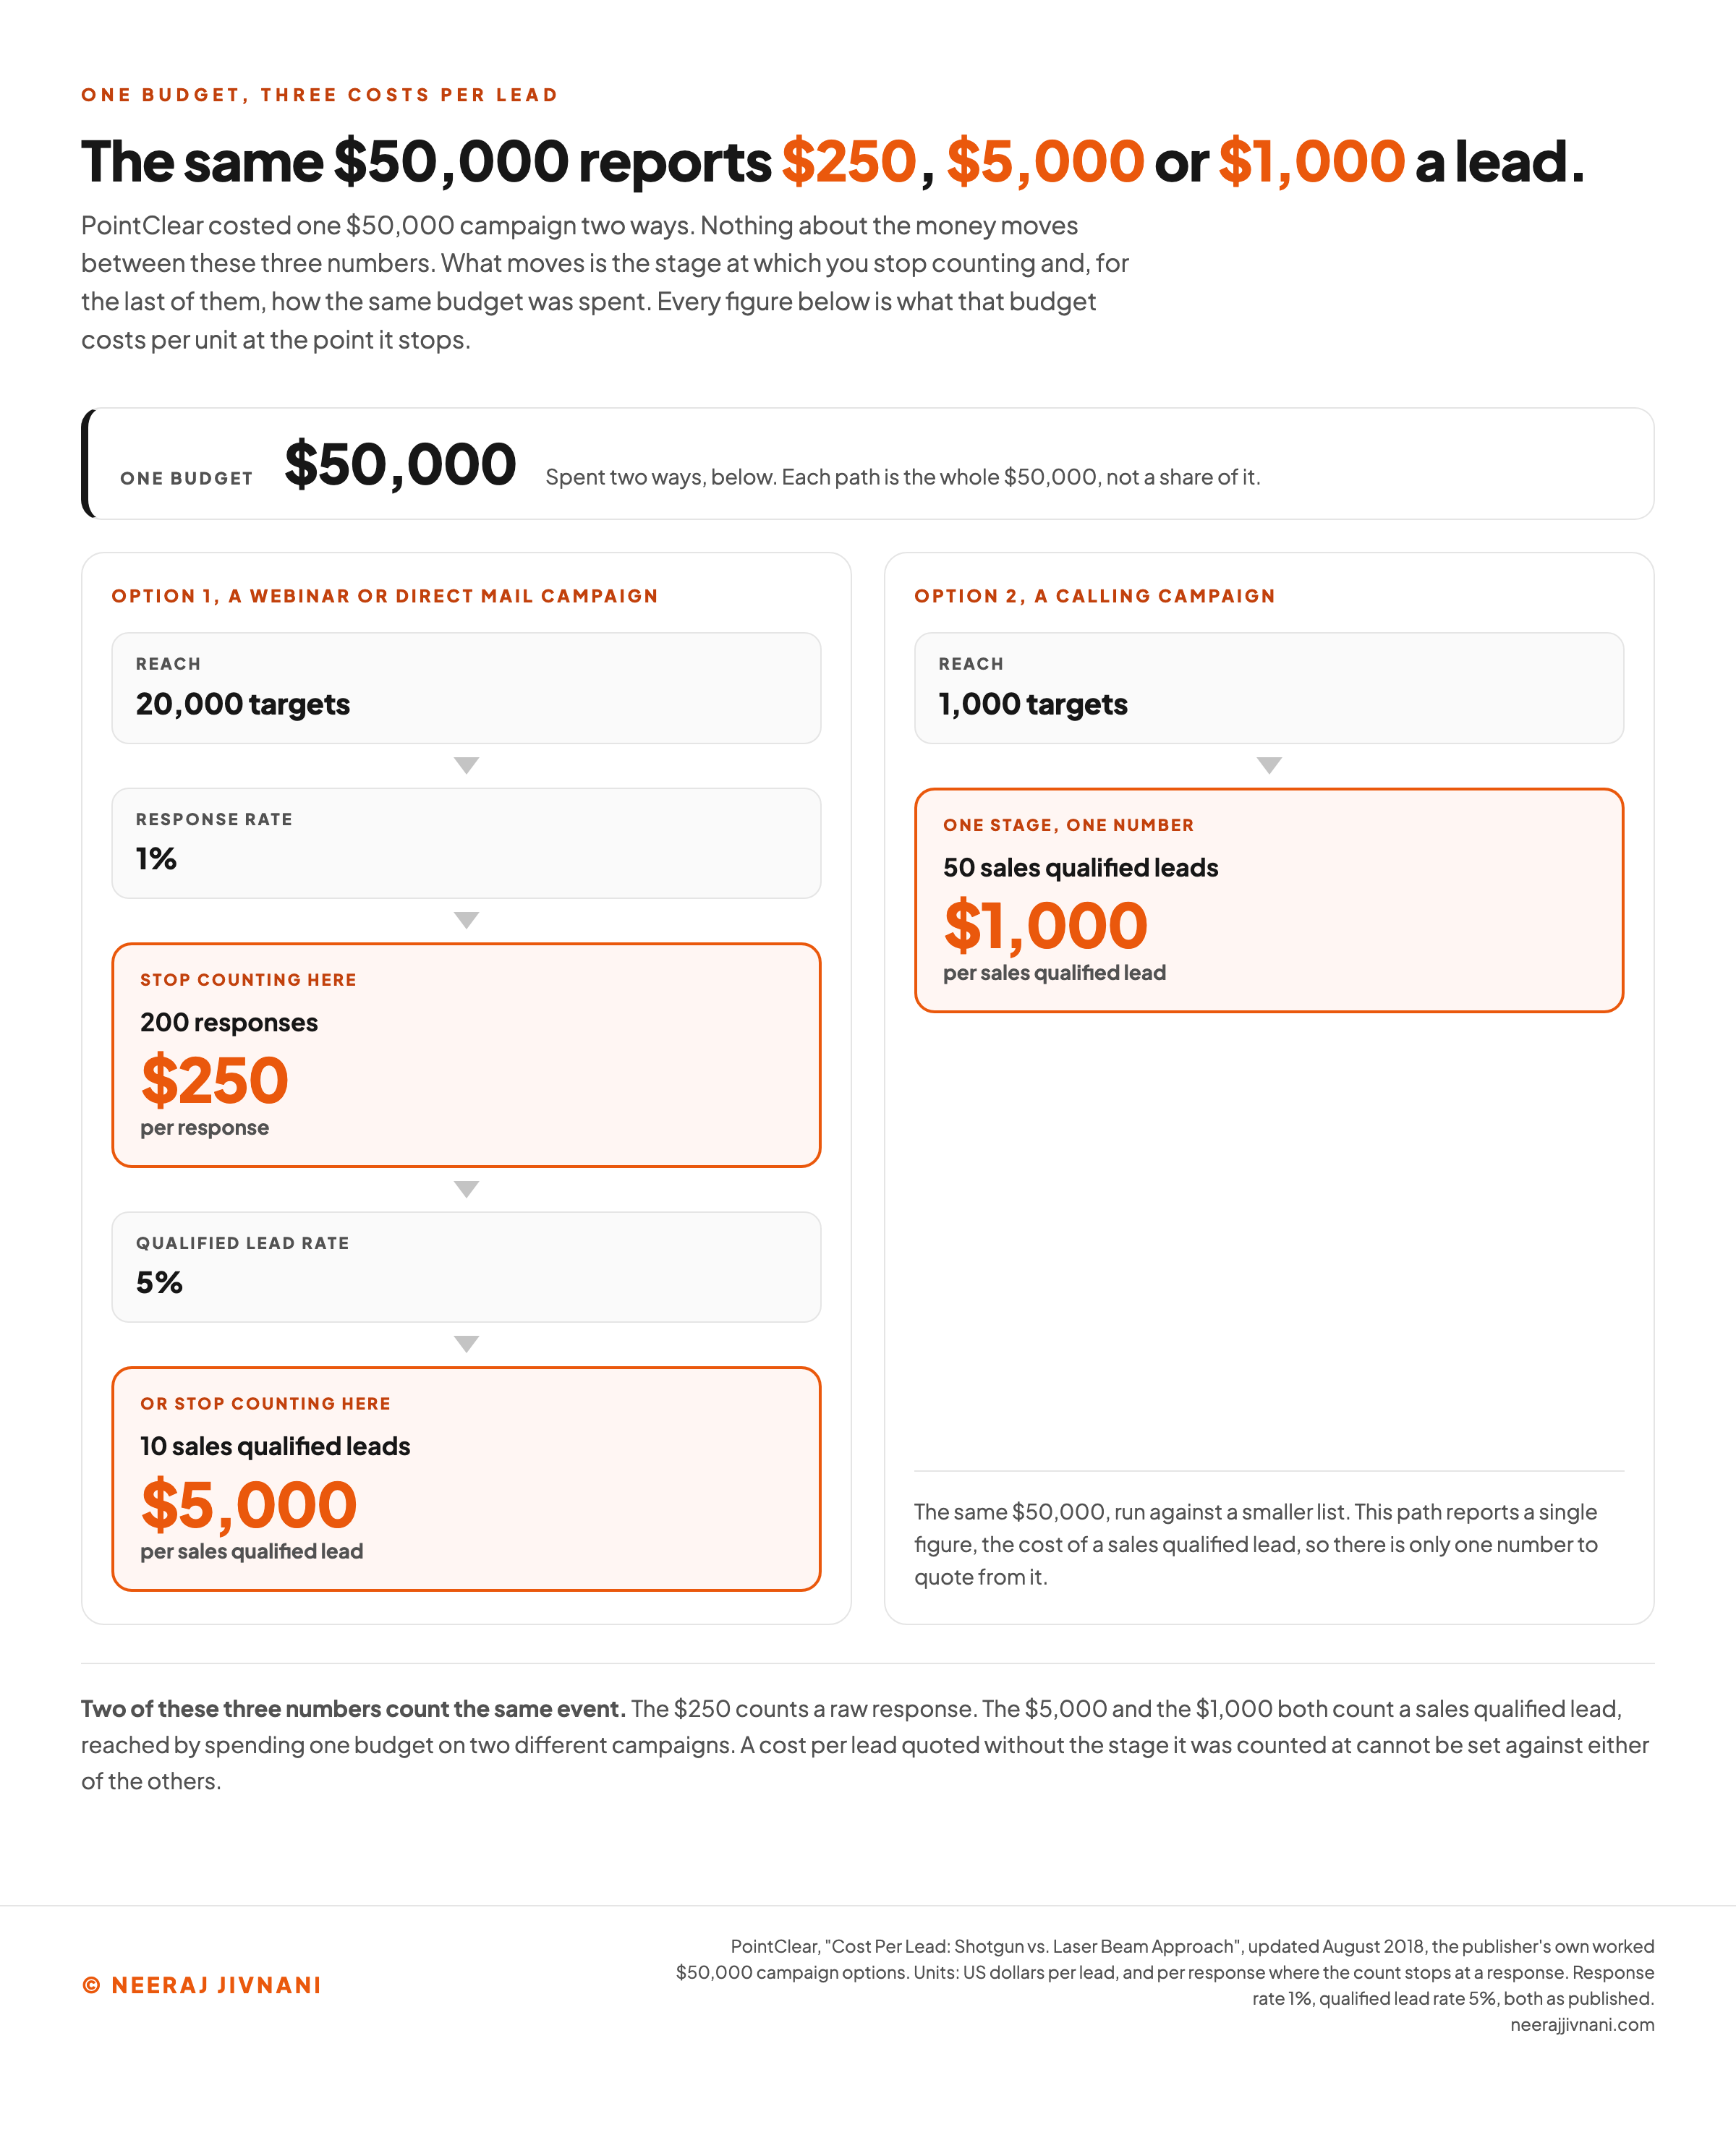
The same effect shows up inside a single budget. PointClear priced one $50,000 campaign two ways in a cost-per-lead point of view updated August 2018.
The first option puts 20,000 targets into a webinar or direct mail campaign at a 1% response rate, which is 200 responses at $250 each. Qualify those at a 5% rate and 10 sales-qualified leads come out at $5,000 each.
The second runs the same money as a 1,000-target calling campaign, which produces 50 sales-qualified leads at $1,000 each.
One budget, three numbers. The $250 and the $5,000 are the same campaign counted at two different stages, and the $1,000 is the same money spent a different way.
The same split turns up on a single page. Mailchimp publishes four formulas for one metric and works each of them.
The overall formula turns $5,000 and 125 leads into $40, while $1,000 of email gives $25 and $2,500 of paid ads gives $50. The qualified formulas give $125 for a marketing-qualified lead and $200 for a sales-qualified one.
Five numbers, one metric, one page. Each is correct, and any two of them compare only if they divide by the same kind of lead.
Your Divisor, in One Sentence You Keep
Write down the exact action that makes something a lead in your business. Attach that sentence to every number you report. It takes a minute, and it is the only thing that makes the rest of the metric portable.
The metric travels under several other names, most of them dividing by something narrower: cost per qualified lead, cost per marketing qualified lead, cost per sales qualified lead, cost per goal completion, cost per action, and lead acquisition cost.
One of those, cost per action, is also the name of a separate metric, which is where a lot of the confusion around this number starts.
The divisor moves by channel too. Here is a workable default for each, from Sparkle's July 2025 guide, if you do not have your own.
- Cold email is divided by positive replies or meetings booked, not by sends.
- Cold calling is divided by qualified calls booked, on your own qualification criteria.
- Paid ads are divided by leads from form submissions, segmented by network.
- Organic content is divided by leads from organic traffic, amortized over six to twelve months.
- Social is divided by leads arriving through direct messages or profile visits.
- Webinars are divided by the attendees who convert to marketing-qualified leads, not by registrations.
- Events are divided by the leads scanned or collected on site, filtered afterwards for fit.
You do not have to adopt that list. You do have to pick one and hold it, because a comparison across two definitions is not a comparison.
Write your divisor down
Tick the actions that make somebody a lead in your business, put last period's spend and counts in, and keep the sentence it writes back. That sentence is what makes your number portable.
Which of these counts as a lead, and how many of each did the period produce
$12,000.00 divided by 165 events across 2 actions.
The sentence to keep beside the number
A lead is someone who fills out a form or agrees to be contacted by a sales representative. On $12,000.00 of spend and 165 of those, our cost per lead is $72.73.
Move the bar one row, on the same spend and the same period
Count newsletter subscriptions as well and the same period reports $34.78 a lead. Your spend has not moved. The divisor grew by 180.
Stop counting form fills and the same period reports $480.00 a lead. Your spend has not moved. The divisor shrank by 140.
None of these readings is wrong, and none of them can be set against another, or against a published table, without the sentence that produced it.
Use this chart — embed code and citation
<a href="https://neerajjivnani.com/blog/cost-per-lead/"><img src="https://neerajjivnani.com/infographics/cost-per-lead/divisor-reversal.png" alt="Paired bar chart of four demand generation channels priced on two divisors from Jeff Josephson's November 2013 comparison in Brilliant Results, showing email at $1.00 per unqualified lead against $4,300 per qualified lead, networking at $50 against $310, inbound at $200 against $2,220, and telemarketing at $250 against $287, with the cheapest and most expensive channels swapping places between the two columns." width="1200"></a>
<p>Chart: <a href="https://neerajjivnani.com/blog/cost-per-lead/">Neeraj Jivnani</a></p>Neeraj Jivnani, "Cost Per Lead: How to Calculate It, and Why What You Count Decides the Number", neerajjivnani.com, https://neerajjivnani.com/blog/cost-per-lead/Free to republish with a link back to this page.
Use this chart — embed code and citation
<a href="https://neerajjivnani.com/blog/cost-per-lead/"><img src="https://neerajjivnani.com/infographics/cost-per-lead/one-budget-three-numbers.png" alt="Flow diagram of PointClear's $50,000 campaign options, updated August 2018, showing 20,000 targets at a 1 percent response rate producing 200 responses at $250 each, those qualifying at 5 percent into 10 sales qualified leads at $5,000 each, and a separate 1,000-target calling campaign on the same budget producing 50 sales qualified leads at $1,000 each." width="1200"></a>
<p>Chart: <a href="https://neerajjivnani.com/blog/cost-per-lead/">Neeraj Jivnani</a></p>Neeraj Jivnani, "Cost Per Lead: How to Calculate It, and Why What You Count Decides the Number", neerajjivnani.com, https://neerajjivnani.com/blog/cost-per-lead/Free to republish with a link back to this page.
Cost Per Lead Against CPA, CPC and CAC
Set cost per lead against the three metrics it gets mixed up with, and each one turns out to divide by something different. The neighbors are cost per click (CPC), cost per action (CPA) and customer acquisition cost (CAC).
The boundaries are worth drawing properly, because one of the three gets used loosely as a synonym for cost per lead.
The Four Metrics, and What Each Divides By
Every one of the four is a cost divided by a count, and the count is what separates them. Read the middle column first.
| Metric | What it divides by | What it answers |
|---|---|---|
| Cost per click (CPC) | Clicks on your ad | What the traffic costs |
| Cost per lead (CPL) | Leads, however you define one | What an expression of interest costs |
| Cost per action (CPA) | A completed action, often a purchase | What the action you asked for costs |
| Customer acquisition cost (CAC) | New paying customers | What a customer costs, sales effort included |
The line between cost per lead and customer acquisition cost sits on the object being counted. Cost per lead measures what a lead costs; customer acquisition cost is the average cost of landing a paying customer.
Cost per action splits from cost per lead on what the advertiser pays for. A cost per action campaign pays out on a completed action, most often a purchase, while a cost per lead campaign pays for contact information.
Why CPA Is the Acronym to Watch
CPA stands for cost per acquisition and for cost per action, and those are not the same event. Cost per lead gets pulled into the confusion because it is sometimes used loosely as a synonym for the first.
Spell the acronym out the first time it appears in any report you send.
The practical version is simpler than the taxonomy. Cost per click prices attention, cost per lead prices interest, and customer acquisition cost prices revenue. Pick the one that matches the decision you are about to make.
What a Good Cost Per Lead Is for You
A good cost per lead is one comfortably below what a lead is worth to you. You can work that out this afternoon. No industry average can answer it, because the average does not know your prices or how many of your leads become sales.
Start from what is already in your own accounts, not from a table.
The Arithmetic That Sets Your Ceiling
Lead value is your average sale value times your lead-to-sale rate, the share of leads that become sales. Take the two numbers you already have and multiply them.
WhatConverts works that through with a $4,000 average sale and a 25% lead-to-sale rate, which makes each lead worth $1,000.
Your ceiling is that lead value. Anything under it is profitable before overheads, and anything over it is a loss you are paying to keep making. The gap between the two is your margin for everything else.
When a High Cost Per Lead Is the Right One
A high number is the right one whenever the lead behind it is worth more.
A $200 cost per lead would be too high for a consumer product worth $20 and justified for a B2B sale with a lifetime value in the thousands, on AppsFlyer's own comparison.
A cheap lead that never converts is a worse result than an expensive one that does, and cost per lead on its own cannot tell you which you bought.
Check the number that sits underneath it. If your cost per lead falls while your lead-to-sale rate falls faster, the cheaper leads are costing you money.
The Benchmark Tables, and What Each One Counted
Before you compare your number to a published table, find out what that table counted as a lead.
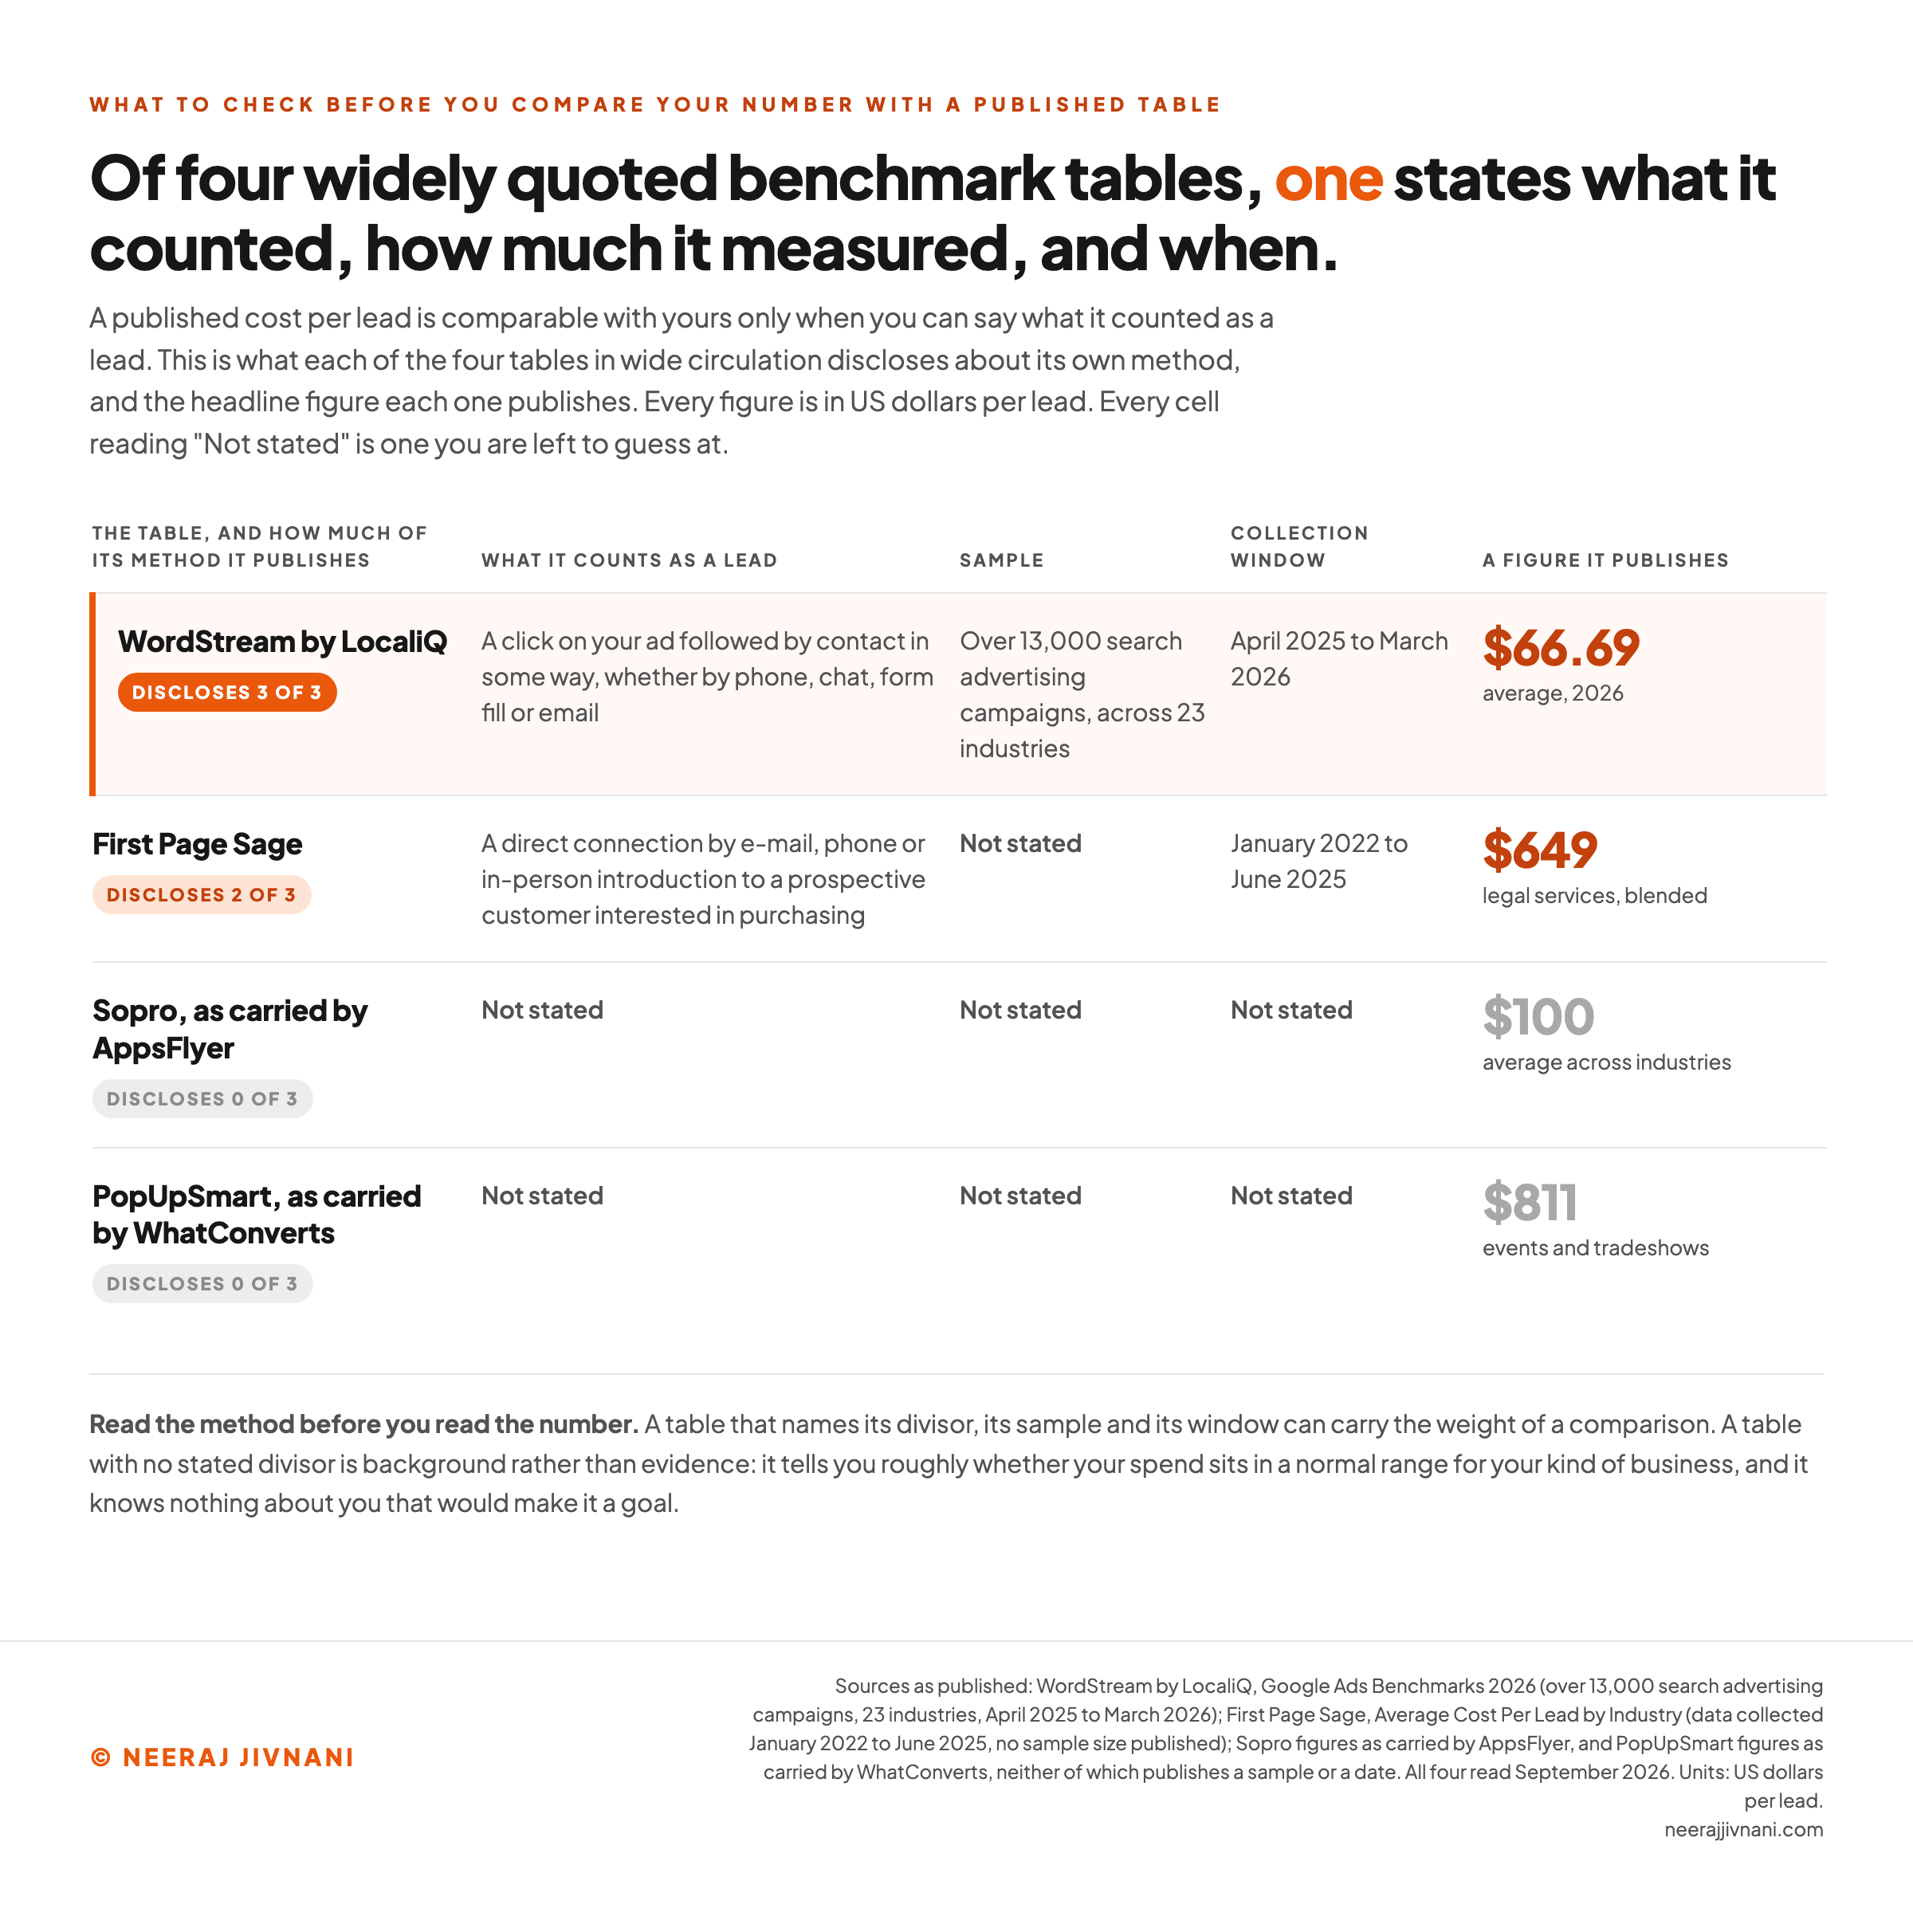
Four tables circulate widely. One of them states its sample, its window and its divisor, and the other three state some of that or none of it.
How much of that a table tells you decides how much weight your comparison can carry.
What the Disclosed Table Says About Itself
WordStream by LocaliQ is the only one of the four that publishes a sample size. Its 2026 report says it "looked at over 13,000 search advertising campaigns across 23 industries running between April 2025 and March 2026".
The campaigns run across Google Ads and Microsoft Ads, which is the population the figures below describe.
That table counts what you spend "for a user to click on your ad and contact you in some way, whether by phone, chat, form fill, or email", the divisor stated in LocaliQ's edition of the same report.
On that definition the 2026 average is $66.69.
Attorneys and legal services sit highest at $131.63, followed by furniture at $106.70 and real estate at $102.51. Arts and entertainment sits lowest at $26.84, and dentists and dental services come in at $72.97.
The report also carries a movement worth knowing. WordStream has 2026 as the first fall in five years, though the average is still above the $59.18 its series started at in 2016.
The Tables That Travel Without Their Method
First Page Sage covers 30 industries split into paid, organic and blended. Legal services blended sits at $649, paid at $784 and organic at $516, and higher education tops the table at $982 blended and $1,261 paid.
Its methodology is one sentence: prepared by its marketing research team, based on data "collected between January 2022 through June 2025". No sample size, no geography and no source for the underlying data appears anywhere on the page.
It does define its divisor, and the definition is not the advertising one.
Its lead is a human connection rather than a click that converted, and it counts paid and organic together.
Two more sources carry less than that. AppsFlyer's industry figures are credited to a Sopro study with no year and no sample, running from education at $40 to healthcare at $386, alongside a $100 average across industries.
Its channel table carries no attribution at all, running from referrals at $25 to events and trade shows at $1,000. WhatConverts publishes a second channel table credited to PopUpSmart and undated, running from events and tradeshows at $811 down to display advertising at $63.
Reddit's marketing glossary republishes twelve of First Page Sage's rows, crediting the name and carrying across neither the collection window nor the lead definition.
Use these tables the way their publishers can support. They tell you roughly whether your spend sits in a normal range for your kind of business, and none of them knows enough about you to be a goal.
A published figure is comparable to yours only when you can say what it counted. Read the method first, and treat a table with no stated divisor as background rather than evidence.
Use this chart — embed code and citation
<a href="https://neerajjivnani.com/blog/cost-per-lead/"><img src="https://neerajjivnani.com/infographics/cost-per-lead/what-each-table-counted.png" alt="Comparison table of four published cost per lead benchmark sources scored on what each one discloses, showing WordStream by LocaliQ stating a divisor, a sample of over 13,000 campaigns and an April 2025 to March 2026 window with a $66.69 average, First Page Sage stating a divisor and a January 2022 to June 2025 window with no sample and a $649 blended figure for legal services, Sopro via AppsFlyer stating none of the three with a $100 average, and PopUpSmart via WhatConverts stating none of the three with an $811 events figure." width="1200"></a>
<p>Chart: <a href="https://neerajjivnani.com/blog/cost-per-lead/">Neeraj Jivnani</a></p>Neeraj Jivnani, "Cost Per Lead: How to Calculate It, and Why What You Count Decides the Number", neerajjivnani.com, https://neerajjivnani.com/blog/cost-per-lead/Free to republish with a link back to this page.
Why Your Cost Per Lead Rose, and What Moves It
A rising cost per lead has a short list of usual causes, and each one moves the number in a way you can measure. Work down the list in order, because the cheap fixes sit at the top.
Nothing on it needs a new tool, and most of it can be checked inside the ad account you already have.
The Eight Causes, and the Fix for Each
Eight causes come up again and again, and each one has a fix.
- Targeting the wrong audience. Broad or poorly defined targeting buys clicks from people who were never going to convert. Narrow to the traits your best customers share before you touch anything else.
- Weak creative. Generic copy and low-quality visuals waste the impressions you paid for. Lead with what the reader gets, and test formats rather than adjectives.
- A landing page that leaks. Slow loads, cluttered layouts and a message that does not match the ad all raise the price of every lead behind them. Conversion rate optimization starts here: match the page to the ad promise and cut the form to the fields you need.
- Over-broad campaigns. One campaign covering every age, device and location buys a lot of irrelevant clicks. Split it into focused ad groups so bids and messages can differ.
- No retargeting. Spending only on cold audiences means paying full price for people who need several touches. Re-engage visitors who already know you.
- Poor budget allocation. Money left in weak campaigns while strong ones run out drags the average up. Move it on the evidence you already have.
- No testing. Without a test you are guessing which headline or form field is costing you. Change one variable at a time and wait for significance.
- The wrong bidding strategy. Bidding for clicks when you want leads overpays for traffic that does not convert. Align the bid strategy to the goal, then adjust by device, location and time.
All eight work on one of two levers. You either spend less, or you get more leads for the same money.
The Ninth Cause, and Why It Looks Like Good News
Getting more leads for the same money is where the ninth cause hides. Your cost per lead can fall because you changed what you counted, not because you got better at buying.
Turn on a newsletter form, start counting chat openers, or move the qualification bar down a notch. The divisor grows while the spend holds. The metric drops and nothing about the business improved.
Watch for the pattern rather than the number. When cost per lead falls and the count of leads that reach a sales conversation stays flat, the definition moved.
When Cost Per Lead Is the Wrong Number to Watch
Cost per lead stops being the right number the moment your leads stop converting at a steady rate. It prices the top of the funnel and is blind to everything after it.
The clearest symptom is a falling cost per lead beside a rising cost per customer. That combination says you are buying more leads for less money and fewer of them are worth having.
Count the sales conversations to tell this apart from a widened definition. If that count rises while the customers behind it do not, quality fell. If it holds flat while the metric drops, the definition moved.
Two other cases call for a different number, such as customer acquisition cost or the count of leads that reach a sales conversation.
If your sales cycle is long and each order is large, acquisition cost carries more of the answer. It counts the sales effort that cost per lead leaves out.
If you buy leads at a contracted price rather than reporting on your own, the price is fixed and your real question is what share of them qualify. Cost per lead has nothing to add to a number somebody else set.
What is left is yours alone. Name the exact action that makes somebody a lead, then work out what one of those is worth once your lead-to-sale rate is applied to your average sale.
Write both down. A cost per lead with that definition and that ceiling beside it can be compared, defended and acted on, and one without them is arithmetic with no unit attached.