Marketing Analytics: What It Covers, and Why Measuring Is Not the Same as Deciding
Marketing analytics is easy to buy and hard to act on. See where web analytics stops, which type you need, and what to fix before you choose a tool.

/ On this page14 sections
Marketing analytics is the measurement of marketing activity across every channel a company runs, and then the use of that data to decide where the next dollar goes. The measuring half is now easy to buy.
The deciding half is where teams get stuck, and the reason is rarely the tool.
Most of what goes wrong sits in four places: the boundary with web analytics, the credit rule nobody chose, the data that was never joined, and the order things were bought in.
What Marketing Analytics Is, and Where It Stops Being Web Analytics
Three things sit inside marketing analytics and only the first is a measurement. Somebody collects the numbers, somebody analyzes them, and somebody moves the money.
The discipline is judged on the third.
Start with where the data comes from, because that constrains everything after it. Three kinds arrive, and the difference decides what you are allowed to do with each:
- First-party data is collected directly from your own users, which makes it the only kind whose definitions you control.
- Second-party data is another organization's first-party data, shared with you under an agreement that also sets the limits on it.
- Third-party data is collected and sold by companies with no connection to you or your customers, so you inherit both its coverage and its gaps.
Where Web Analytics Stops
Web analytics is a narrower thing. It measures one property, usually a website, and reports what happened on it.
Marketing analytics measures every channel that touches a buyer, then chooses between them.
A website report can tell you which page converted. It cannot tell you whether the money should have gone to email instead.
Say a buyer sees a paid ad and ignores it, opens an email a week later, then searches for the brand by name and buys. The website report shows one visit from search.
The two channels that started it are not in that file at all.
Getting them into the same picture is the job. Three terms get used as if they were one, and they are not:
- Marketing analytics covers every channel and activity, paid and organic, online and off.
- Digital analytics covers the digital channels only.
- Web analytics narrows to the performance of a single property.
Buy the third when you need the first and the tool will answer every question except the one you had.
The Types of Marketing Analytics, and the Four Axes They Are Cut On
The four types you probably came for are descriptive, diagnostic, predictive and prescriptive. That is one list, and it is not the only one.
The types of marketing analytics come in several different lists, and no two of them match. That is not sloppiness on anybody's part.
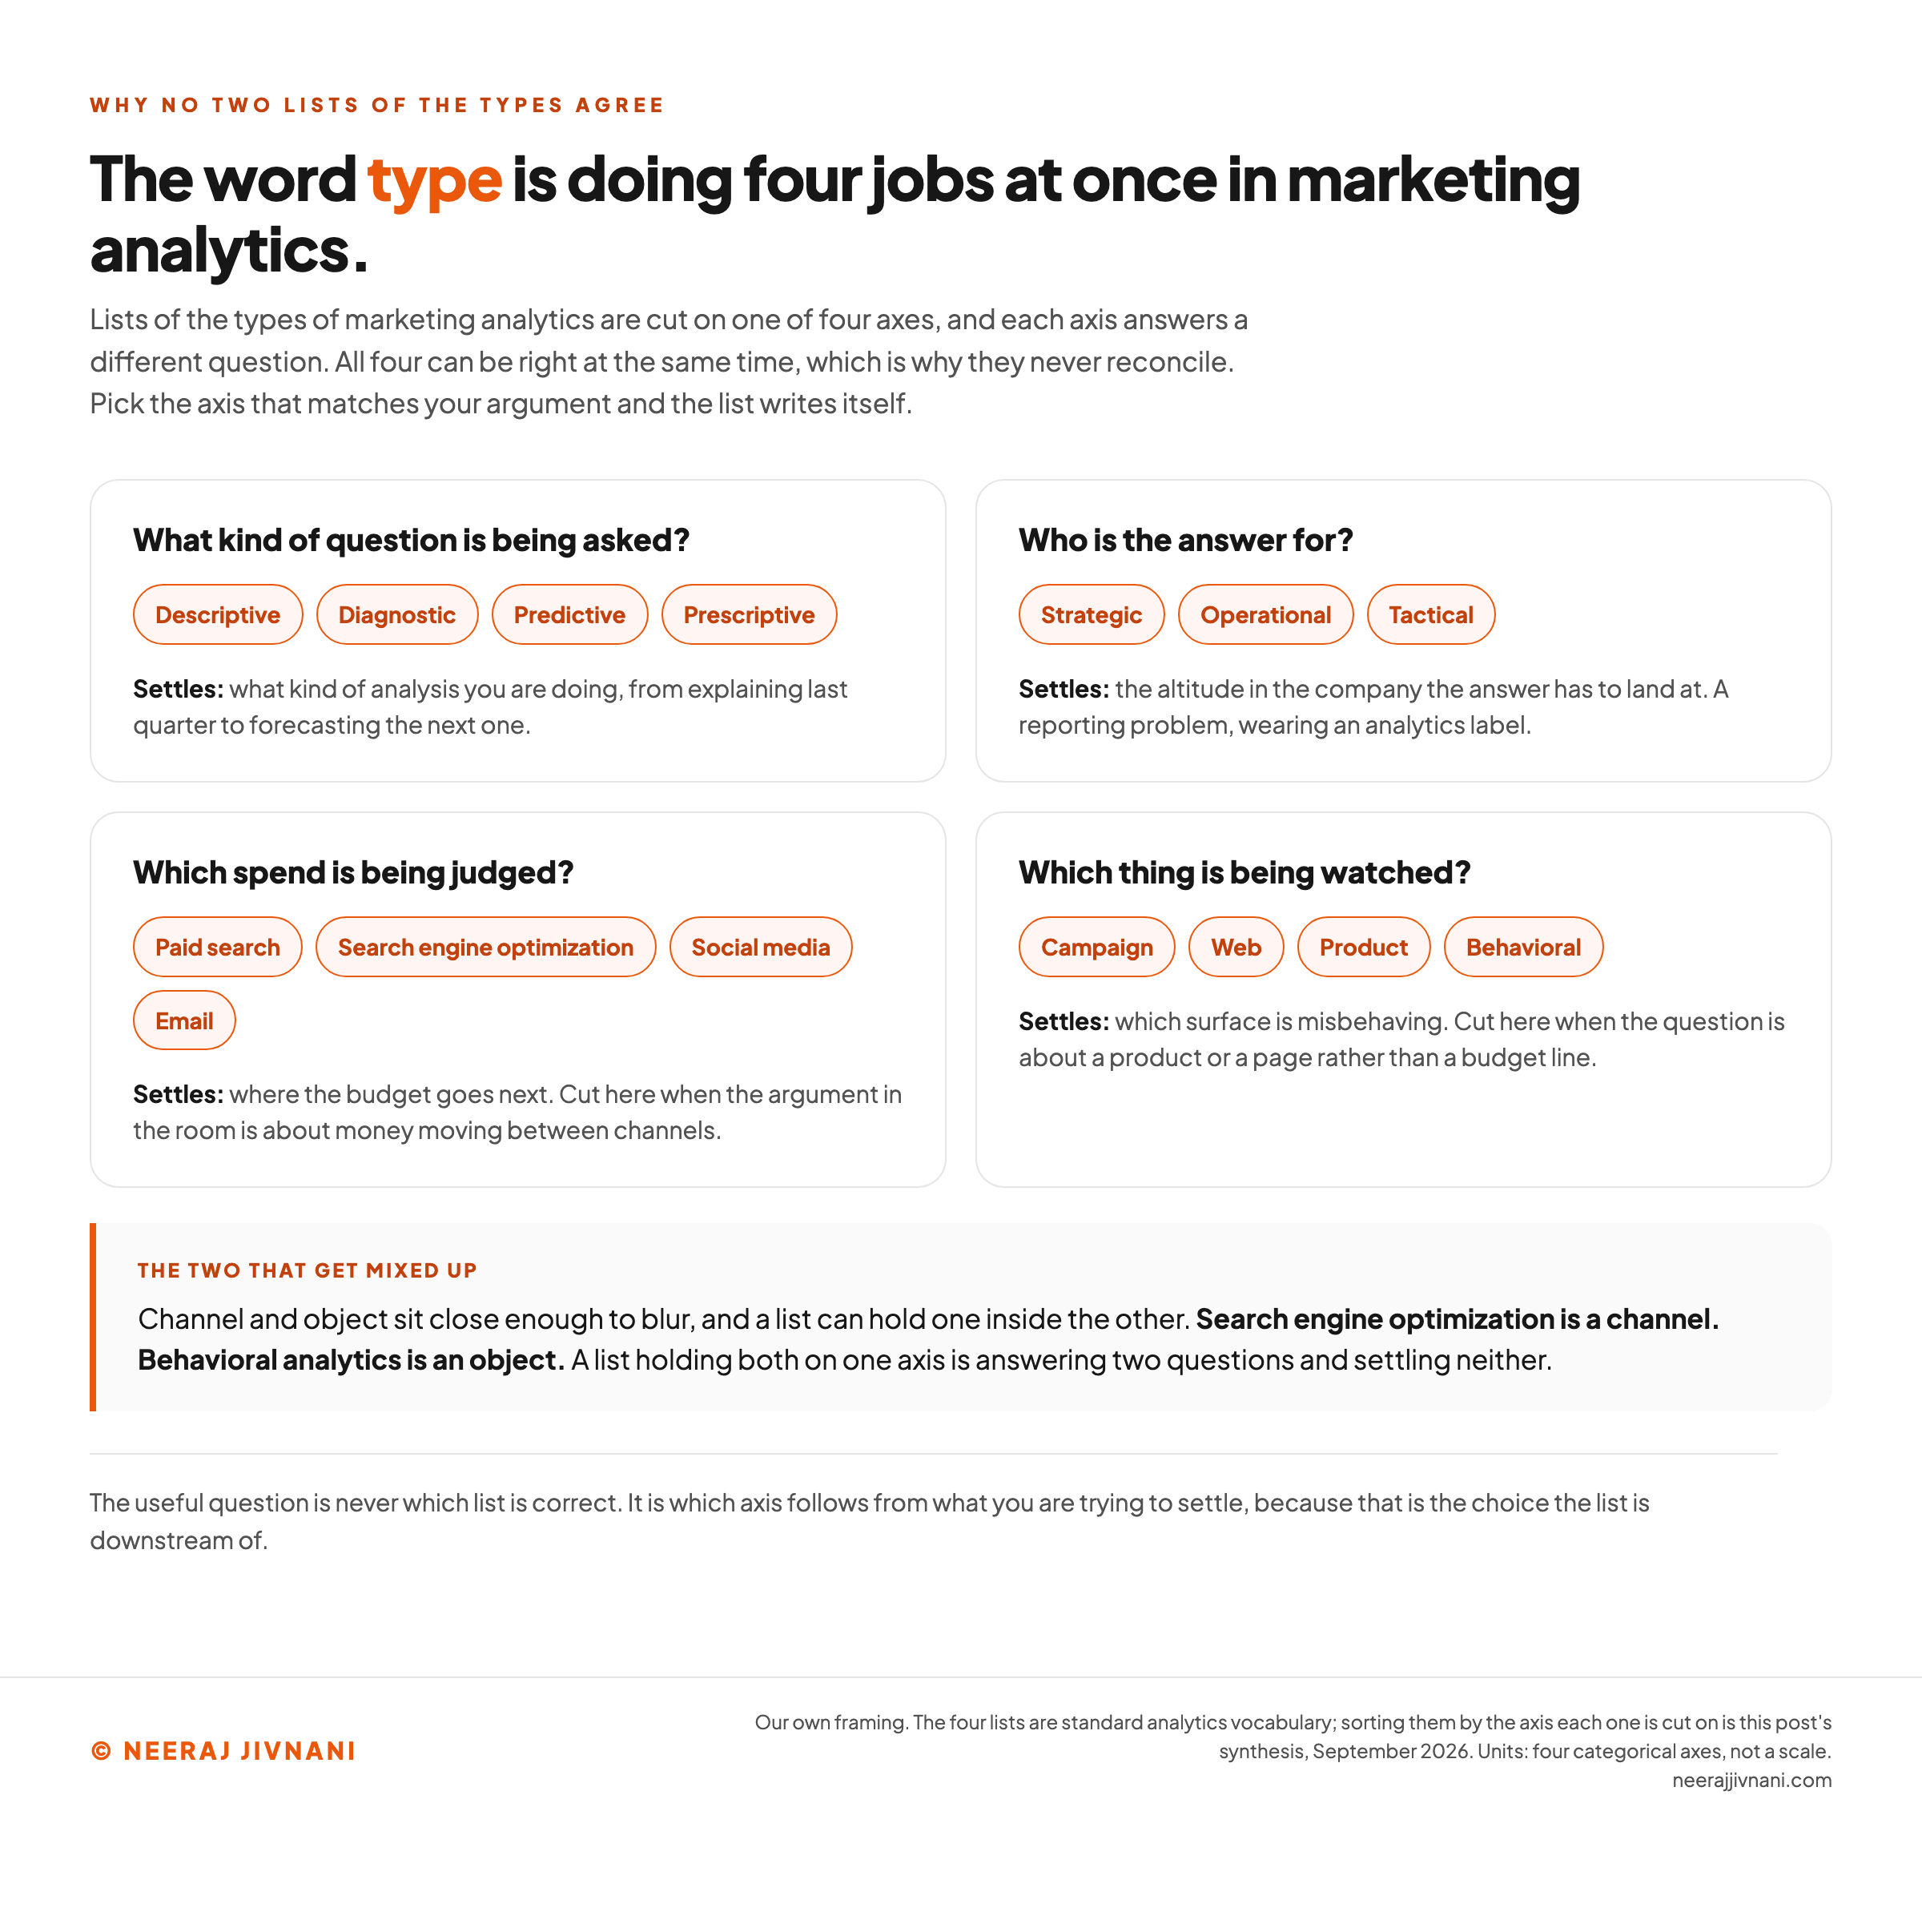
The word type is doing four jobs at once. Each list is cut on a different axis, and each axis answers a different question:
| The axis | The list it produces | What it settles |
|---|---|---|
| The question being asked | Descriptive, diagnostic, predictive, prescriptive | What kind of analysis you are doing |
| Altitude in the company | Strategic, operational, tactical | Who the answer is for |
| The channel the spend goes to | Paid search, search engine optimization, social media, email | Which spend you are judging |
| The object being watched | Campaign, web, product, behavioral | Which thing you are watching |
All four can be right at once, because they are answers to different questions.
The last two blur, and that is worth knowing before somebody hands you a taxonomy. Search engine optimization is a channel. Behavioral analytics is an object.
A list holding both on one axis is answering two questions and settling neither.
Which Axis You Are Cutting On
The useful question is never which list is correct. It is which axis follows from what you are trying to settle.
If the argument in the room is about what happened last quarter and what to do next, you are on the question axis, and descriptive through prescriptive is the ladder you are climbing.
If the argument is about who gets the answer and at what altitude, that is a reporting problem wearing an analytics label.
If it is about where the budget goes, cut by channel. If it is about which product or surface is misbehaving, cut by object.
Pick the axis first and the list writes itself.
Use this chart — embed code and citation
<a href="https://neerajjivnani.com/blog/marketing-analytics/"><img src="https://neerajjivnani.com/infographics/marketing-analytics/four-axes.png" alt="Diagram of the four axes the types of marketing analytics are cut on, each with the list it produces and the question it settles: the question being asked yields descriptive, diagnostic, predictive and prescriptive; altitude in the company yields strategic, operational and tactical; the channel the spend goes to yields paid search, search engine optimization, social media and email; and the object being watched yields campaign, web, product and behavioral." width="1200"></a>
<p>Chart: <a href="https://neerajjivnani.com/blog/marketing-analytics/">Neeraj Jivnani</a></p>Neeraj Jivnani, "Marketing Analytics: What It Covers, and Why Measuring Is Not the Same as Deciding", neerajjivnani.com, https://neerajjivnani.com/blog/marketing-analytics/Free to republish with a link back to this page.
Half the Numbers Never Meet the Other Half
The numbers come from the channels, the website, the sales system and whatever the company buys in to fill the gaps. Getting them into one place is where most of the work goes.
20% said their customer data is fully unified, with actionable journey views across nearly all channels, in an April 2026 survey of 103 senior marketers by the Marketing + Media Alliance, or MMA Global. Another 38% called theirs mostly unified and 36% partially unified.
Add the 36% with partial visibility to the 5% who are fully siloed, and two teams in five cannot follow a customer end to end.
Trust, and the Cost of Explaining a Number First
Trust has the same problem in a different place.
36% said their data is trustworthy as presented, and 50% said it is generally good but needs a lot of explanation before it can be trusted.
Data that has to be explained before it can be trusted is the constraint that decides how fast anything moves. Every question costs a conversation before it costs an analysis.
Where the First-Party Investment Is Going
First-party data is where the investment is going, and it is going there unevenly. 38% said they operate a privacy-compliant collection and storage system and treat first-party data as a strategic asset, and 43% said they have defined collection strategies without that.
Enrichment is still bought in. 50% said they enrich their first-party data with third-party data to support analysis and scenario work.
The Metrics Teams Use to Call Something a Success
The metrics that decide whether marketing worked are not the ones a channel reports. Asked for the top three they use to define success, teams pick sales and the signals that lead to it, in the same April 2026 survey.
| What the metric settles | The metric | Share choosing it |
|---|---|---|
| Did revenue move | Sales | 51% |
| Did anyone respond | Engagement, such as click-through rates, open rates and video views | 50% |
| Is the brand better known | Brand awareness | 44% |
| Is the pipeline filling | Lead generation | 37% |
| Is ground being won | Market share | 30% |
| What did a customer cost | Customer acquisition cost | 30% |
| Do they stay | Retention and loyalty metrics | 25% |
| How many saw it | Campaign reach and frequency | 19% |
Reach comes last, and that is the useful part of the table.
The metric easiest to produce is the one fewest teams will accept as evidence.
If your reporting leads with impressions, you are answering a question nobody in the room is asking.
The Five Dimensions Return on Investment Gets Cut By
Return on investment (ROI) is calculated on more than one dimension, and the shares say which question companies are answering. 69% calculate it by marketing channel, 57% by product or service, 50% by campaign, 38% by customer and 37% by content type.
Channel-first means the question being answered is where to move the budget.
Customer-level ROI, at 38%, is the harder one and the rarer one.
The formula is the easy part: net profit divided by cost of investment, expressed as a percentage. Deciding what counts as the profit and what counts as the cost is where the argument lives.
What teams rely on to get there splits along a line between what is convenient and what is rigorous. Platform metrics lead at 41% high reliance and A/B testing follows at 37%.
Incrementality testing, marketing mix modeling and multi-touch attribution sit in the middle tiers.
Attribution: What It Can Settle, and What Almost Nobody Has
Attribution is the attempt to say which marketing touch caused a sale. Credit is being assigned rather than measured, and holding it that way will save you a lot of arguments.
There is a ladder of methods, and the rungs get more expensive as you climb.
Last-click attribution credits the final touch. Multi-touch attribution splits credit across the interactions that played a part.
Incrementality testing asks a different question: whether the same result would have happened without the campaign at all. Marketing mix modeling uses regression to separate the effect of each channel from everything else moving at the same time.
19% of teams have a complete, always-on attribution program, 56% have structured multi-touch or econometric attribution working in pockets, 21% have first or last-touch attribution only, and 3% have none, in the April 2026 survey.
So fewer than one team in five has attribution running everywhere.
A similar share is working from one touch, first or last, and a few assign no credit at all.
That distribution explains more disagreement about marketing performance than any tool choice does.
Two people looking at the same month can honestly report different winners.
Measuring Is Common. Deciding Is Not.
Measuring is now common, and so is the appetite for it. 71% of the companies surveyed use marketing data daily or weekly.
22% put their analytics capabilities in the top band and another 58% in the one below it, described as established and growing.
Only 19% said their processes and tools lack sophistication, and nobody chose the bottom option.
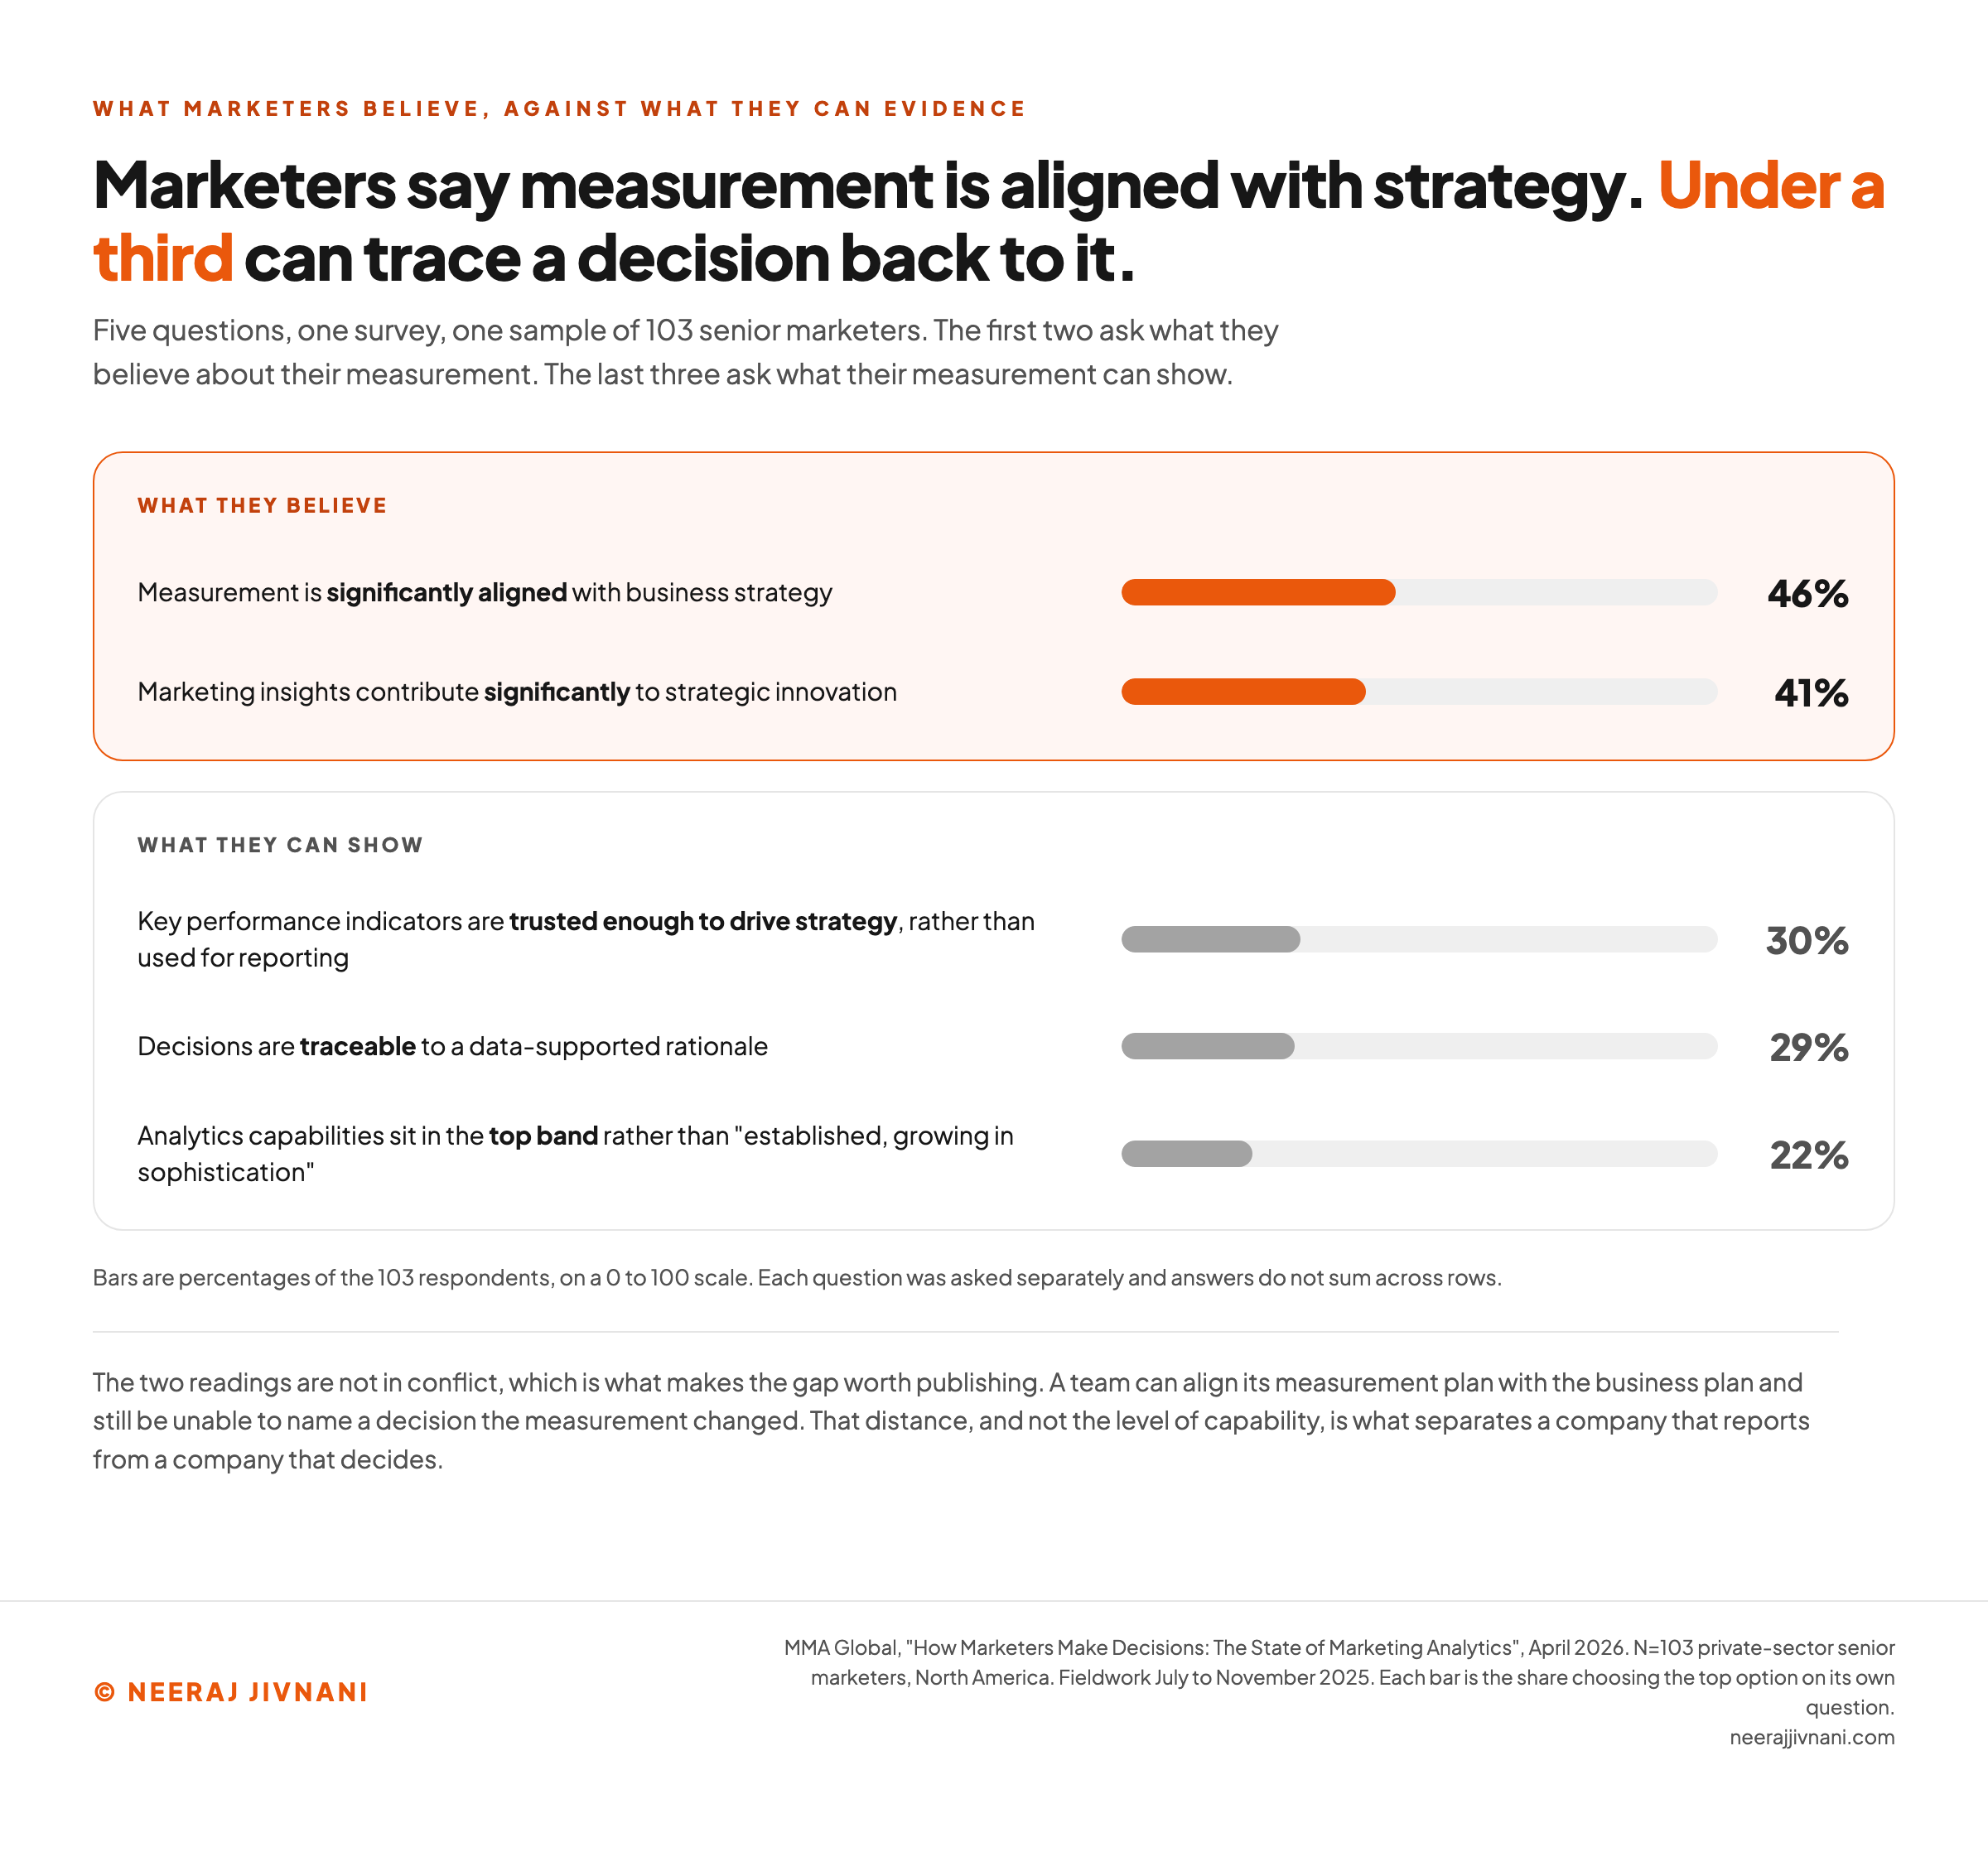
Deciding is a different count. 30% said their key performance indicators are trusted, adopted and relied on for driving strategy, while 51% said they are adopted and consistently used for reporting.
29% said decisions are traceable to a data-supported rationale. Another 47% said decision-making is weighted toward data without being traceable to it.
Set that against what the same people believe about themselves. 46% said measurement is significantly aligned with business strategy, and 41% said marketing-produced insights contribute significantly to strategic innovation.
Belief runs well ahead of evidence.
Both answers are self-reported, which is what makes the pair worth reading. Nobody has to check a claim about alignment, and a claim that a decision is traceable is one a colleague could ask you to produce.
The caveat belongs with the number. MMA Global is the trade association for this industry rather than a neutral observer, and the sample is 103 senior marketers.
57% of them work for global or international corporations, so this is a picture of large organizations that already take measurement seriously.
Which makes the reading harder on the discipline, not softer.
What the Measurement Is Worth Where It Does Work
Where analytics does change something, respondents named the areas their own insights let them improve.
Channel optimization came first at 73%, then media planning, budgeting and forecasting at 72%, and customer segmentation at 68%. Campaign design followed at 58% and personalization at 53%.
Omni-channel engagement reached 49%. First-party data acquisition came last at 22%, which is a strange place for it given how much of the same report is about first-party data.
Analytics pays off first where the feedback loop is short and the decision is reversible.
Moving budget between channels is both. Changing what you collect about a customer is neither, which is why that work keeps getting postponed and why postponing it is expensive.
Use this chart — embed code and citation
<a href="https://neerajjivnani.com/blog/marketing-analytics/"><img src="https://neerajjivnani.com/infographics/marketing-analytics/aspiration-gap.png" alt="Bar chart contrasting what senior marketers claim about their measurement against what they can evidence, showing 46% saying measurement is significantly aligned with business strategy and 41% saying insights drive innovation, against 30% trusting key performance indicators enough to drive strategy, 29% able to trace decisions back to data and 22% placing their analytics in the top capability band." width="1200"></a>
<p>Chart: <a href="https://neerajjivnani.com/blog/marketing-analytics/">Neeraj Jivnani</a></p>Neeraj Jivnani, "Marketing Analytics: What It Covers, and Why Measuring Is Not the Same as Deciding", neerajjivnani.com, https://neerajjivnani.com/blog/marketing-analytics/Free to republish with a link back to this page.
What the Teams That Do Decide Have in Common
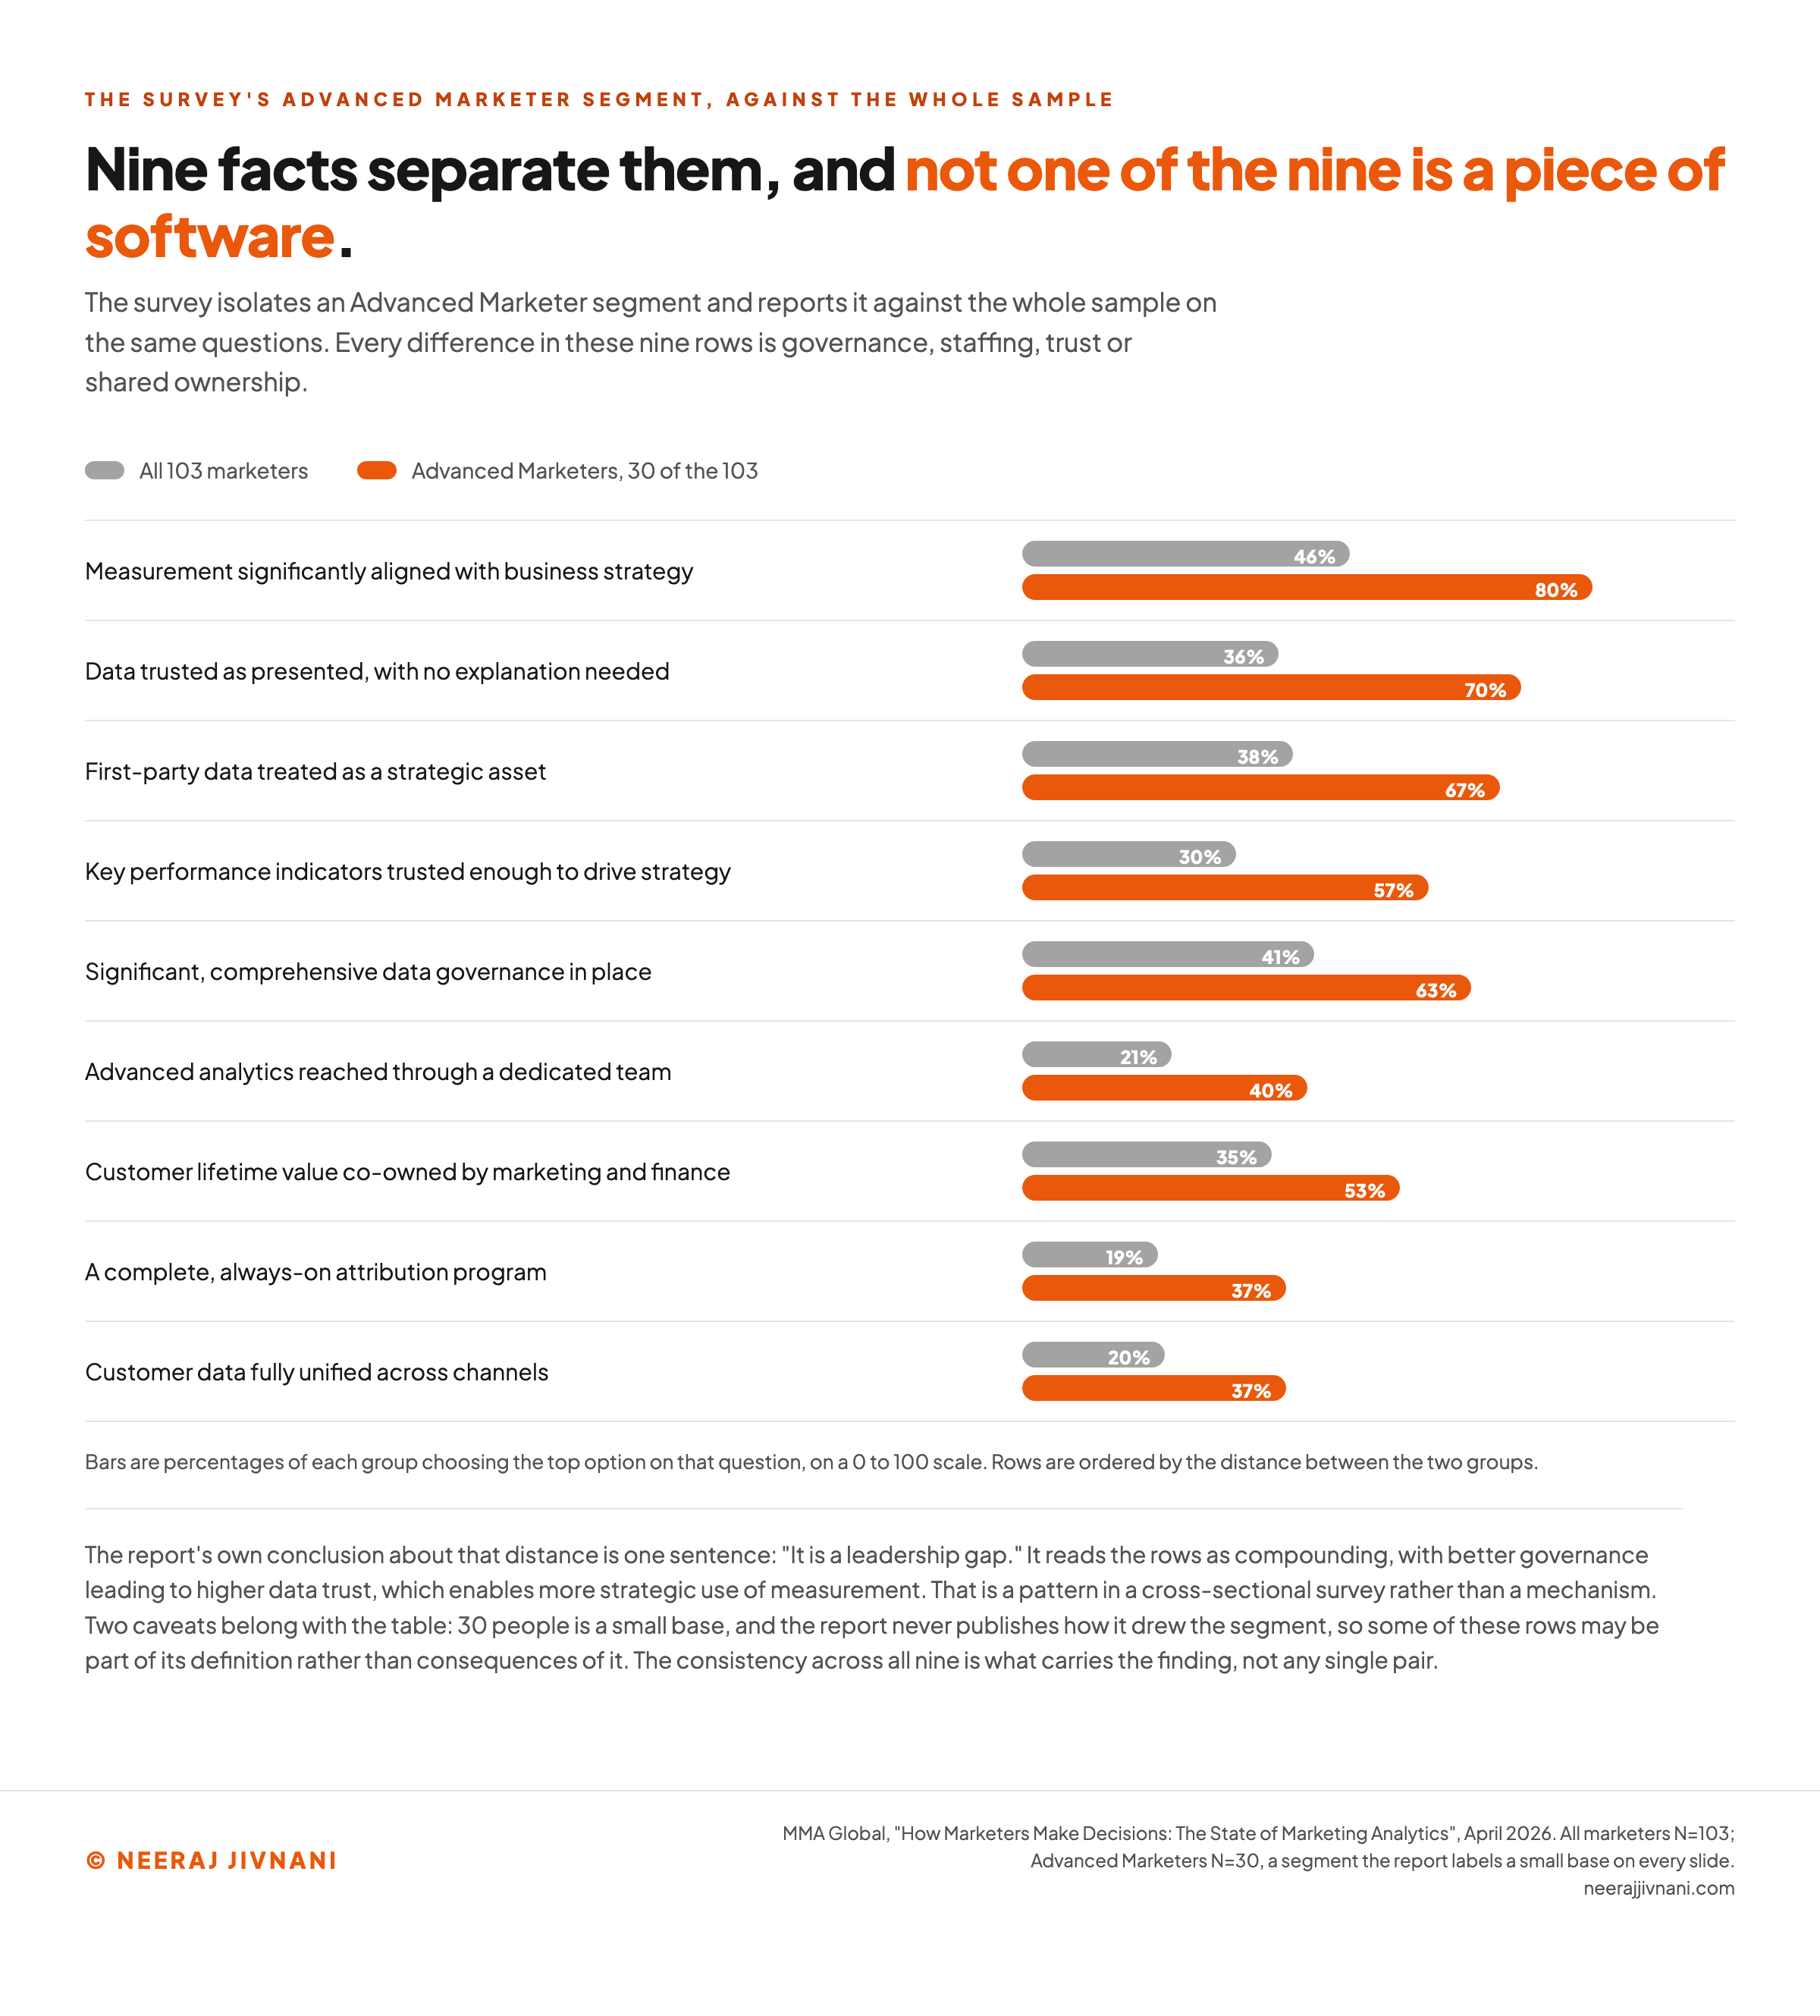
The teams that close that gap are not the ones with better tools. The April 2026 survey isolates a segment it calls Advanced Marketers, 30 of the 103 respondents, and reports them against the whole sample on the same questions.
Nine of those comparisons are organizational rather than technical, and they are the ones worth reading together.
The report goes further, saying the segment stands apart "not because they use different tools, but because they've built fundamentally different organizational infrastructure".
| The organizational fact | All 103 | Advanced Marketers |
|---|---|---|
| Measurement significantly aligned with business strategy | 46% | 80% |
| Data trusted as presented, with no explanation needed | 36% | 70% |
| First-party data treated as a strategic asset | 38% | 67% |
| Key performance indicators trusted enough to drive strategy | 30% | 57% |
| Significant, comprehensive data governance in place | 41% | 63% |
| Advanced analytics reached through a dedicated team | 21% | 40% |
| Customer lifetime value (CLV) co-owned by marketing and finance | 35% | 53% |
| A complete, always-on attribution program | 19% | 37% |
| Customer data fully unified across channels | 20% | 37% |
Not one row is a piece of software. Governance, staffing, trust, shared ownership and the definition of who computes what are the whole list.
That is the finding worth taking, and it is available to a team of any size.
The report's own conclusion is one sentence: "It is a leadership gap."
How Far That Advanced Column Should Be Trusted
The advanced segment is 30 people, and the report labels it a small base on every slide it appears on. One row of it would not be worth quoting on its own.
Nine rows pointing the same way is a different object.
The direction is what the table is evidence for, not the individual gaps.
The report also never says how it drew the line. It names the segment and reports it without publishing the criteria, so some of those nine rows may be part of the definition rather than consequences of it.
The advanced group is also ahead on all four reporting tools at the top reliance tier, interactive dashboards at 57% against 41%, though on ad hoc analysis by a single point.
So the report's own tool slide does not carry its wider claim about tools: it measures how hard each group leans on reporting, not which tools they use.
Even the advanced group has somewhere to go. 60% of them still put their capabilities in the established-and-growing band rather than the top one.
And the questions that stay hard stay hard for everyone. Across all 103, 51% named balancing short-term and long-term goals among their three hardest, 49% named forecasting marketing outcomes, and 38% named evaluating marketing technology effectiveness.
Use this chart — embed code and citation
<a href="https://neerajjivnani.com/blog/marketing-analytics/"><img src="https://neerajjivnani.com/infographics/marketing-analytics/nine-organizational-facts.png" alt="Paired bar chart of nine organizational facts comparing all 103 surveyed senior marketers against the 30 in the Advanced Marketers segment, covering strategic alignment, trusted key performance indicators, data trusted as presented, data governance, a dedicated analytics team, first-party data as a strategic asset, customer lifetime value co-ownership, fully unified customer data and a complete attribution program, none of which is a piece of software." width="1200"></a>
<p>Chart: <a href="https://neerajjivnani.com/blog/marketing-analytics/">Neeraj Jivnani</a></p>Neeraj Jivnani, "Marketing Analytics: What It Covers, and Why Measuring Is Not the Same as Deciding", neerajjivnani.com, https://neerajjivnani.com/blog/marketing-analytics/Free to republish with a link back to this page.
The Four Things a Team Reports With, in the Order They Trust Them
Reporting happens through four kinds of thing, and teams do not lean on them equally. Interactive dashboards lead, at 41% on the top reliance tier of the April 2026 survey.
Ad hoc analysis follows at 32%, standard template-based reports at 28%, and AI-based reporting and analysis last at 26%.
The order matters more than the numbers. A dashboard answers a question somebody already decided was worth watching.
An ad hoc analysis answers the question nobody anticipated, which is the one a decision usually turns on. If your team cannot get one done inside a week, the dashboard is doing less than it looks.
The Named Products, Sorted by Layer
Analytics tools sort into four layers rather than competing with each other, and knowing which layer you are shopping in is most of the buying decision.
- The measurement layer is where the event is recorded. Google Analytics sits here, and so does every channel platform reporting on its own spend.
- The storage and joining layer is where a customer stops being several records. It has product names too, the data warehouse and the customer data platform, and it decides whether the dashboard above it can answer anything.
- The dashboard layer is where those numbers get drawn. Looker, Tableau and Power BI (business intelligence software) live here, alongside the spreadsheet a lot of teams are honestly using, and this is the layer people mean when they say analytics tool.
- The analysis layer is a person and a question, and it has no product name at all.
Most buying conversations start in the dashboard layer, because that is the layer with a demo.
The problem is usually one layer down, where nothing has a demo.
The Third-Party Cookie Deadline Is Gone. So Are Most of Its Replacements.
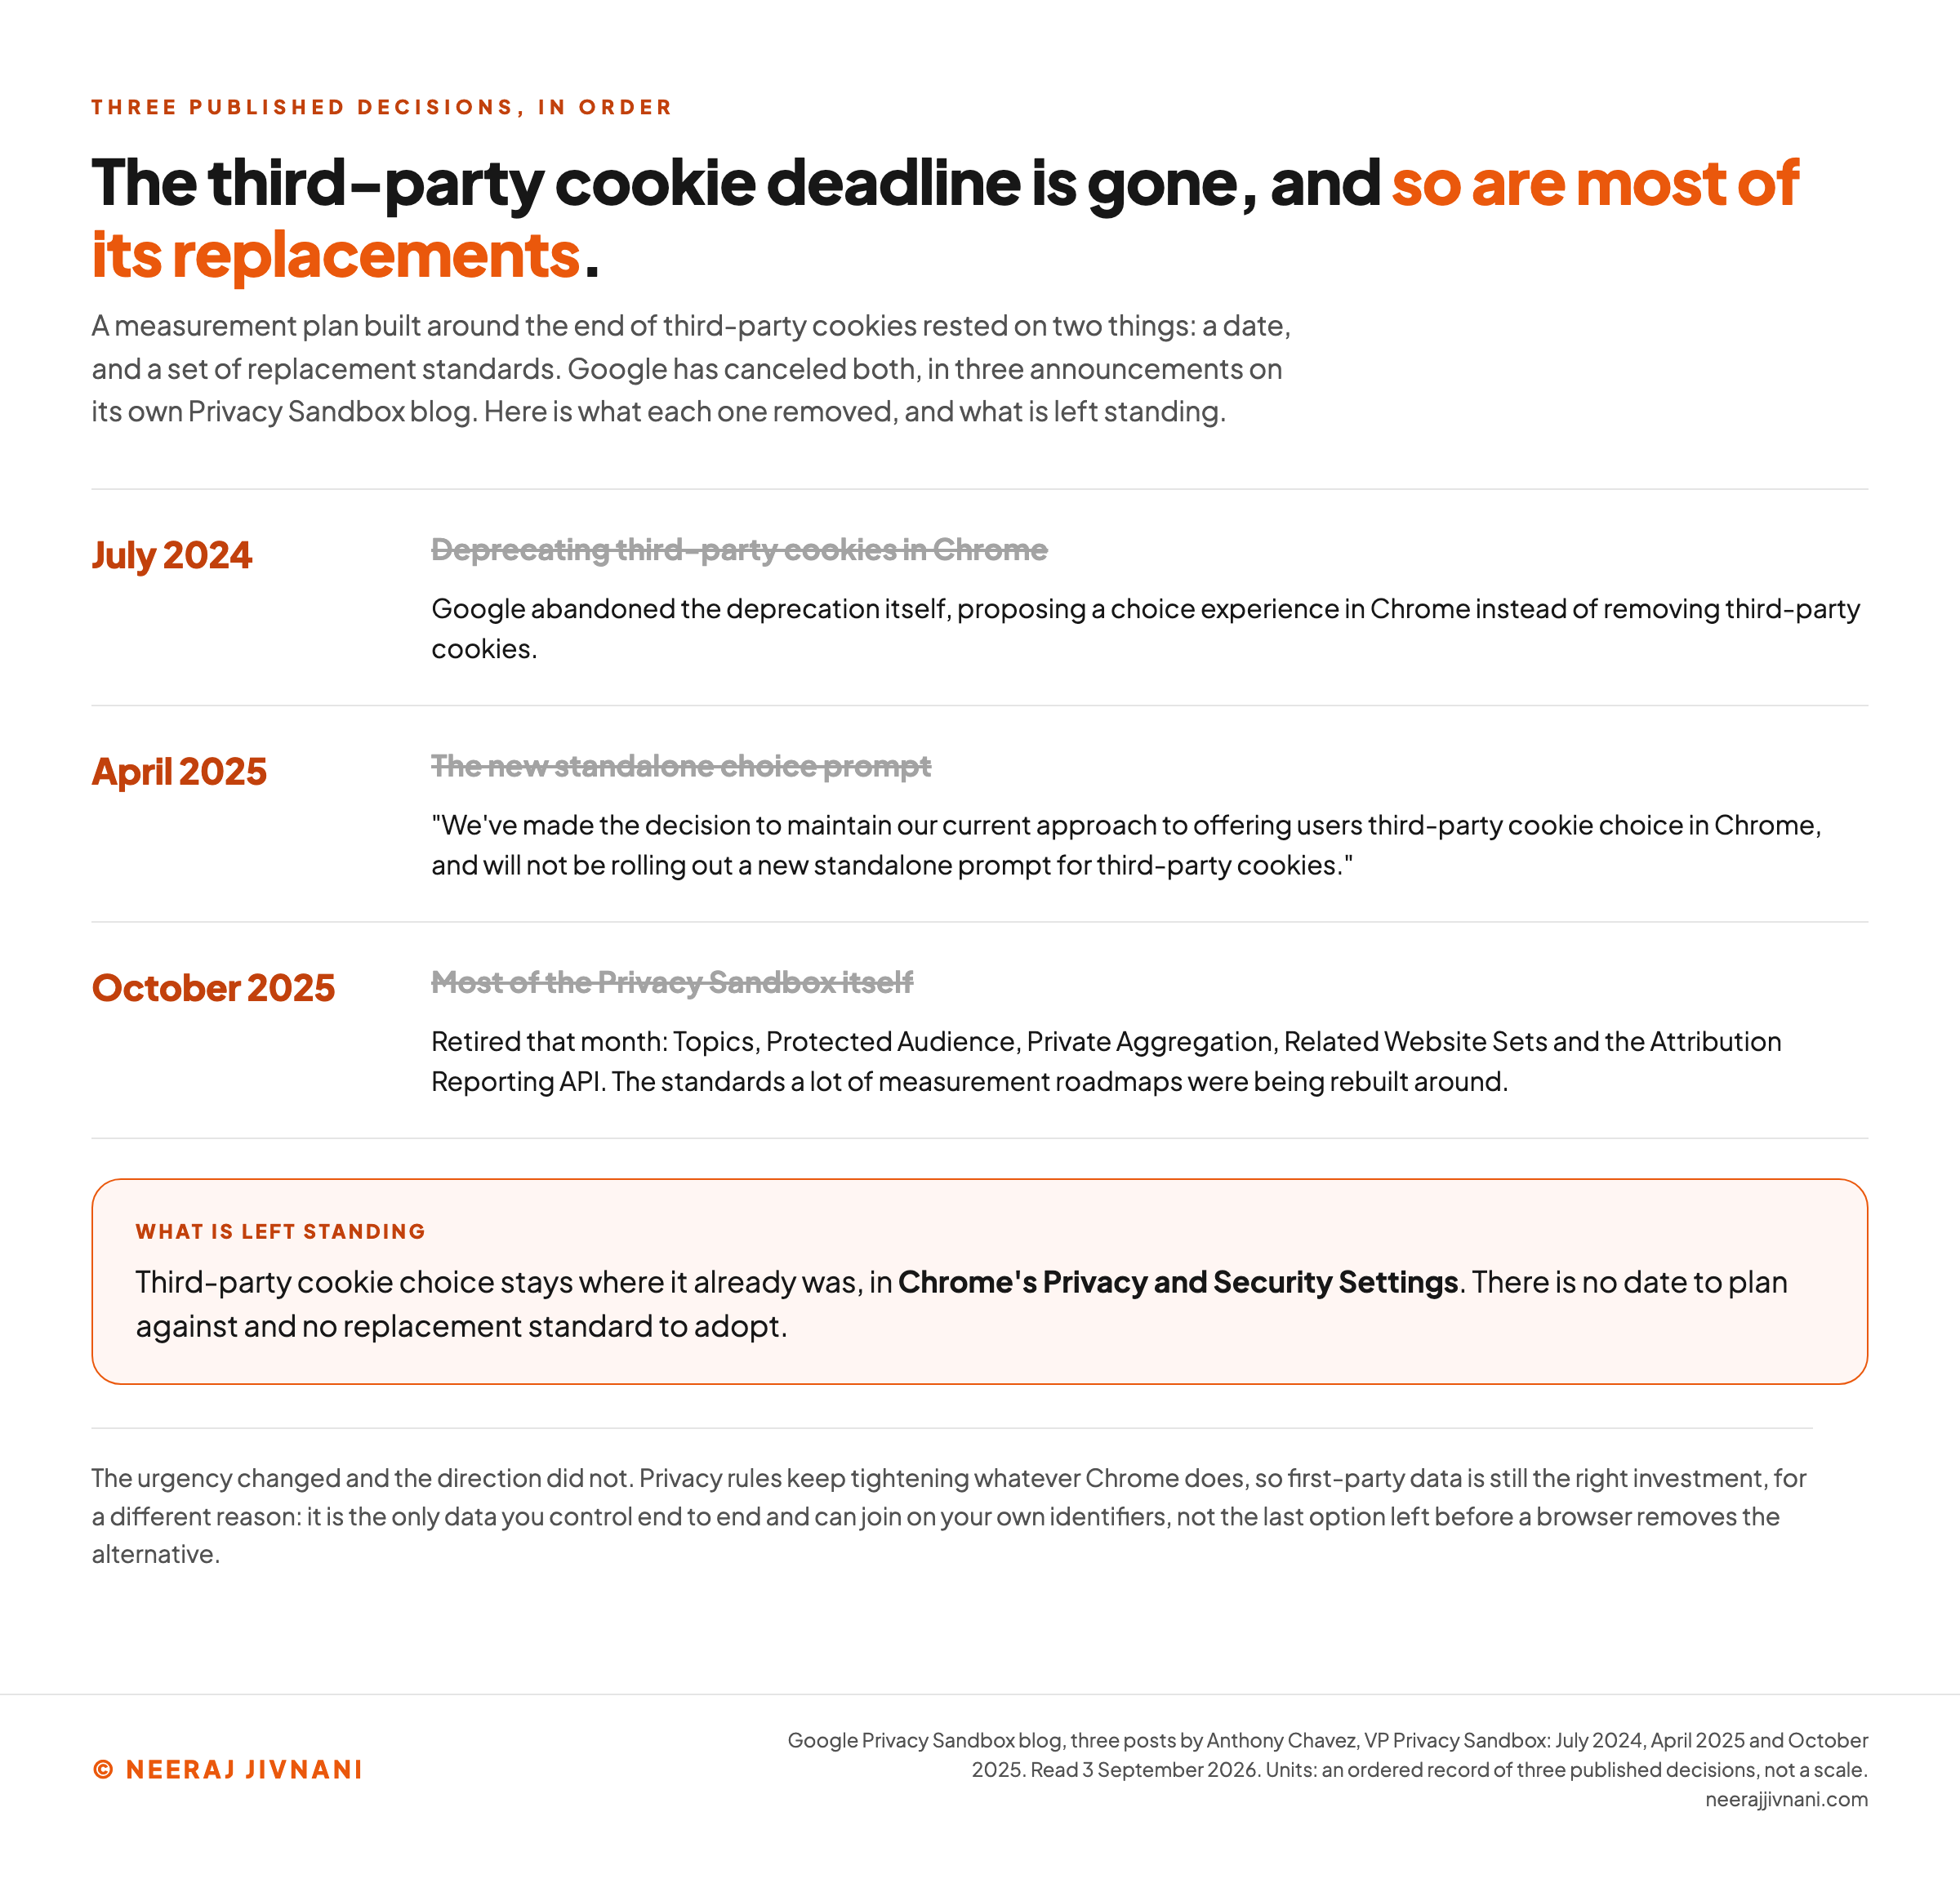
If your measurement plan still has a third-party cookie deadline in it, take the deadline out. The date it was written to no longer exists, and the technologies built to replace it have been retired too.
Here is what happened, in order.
Google abandoned the deprecation itself in July 2024, proposing a choice experience in Chrome instead of removing third-party cookies.
In April 2025 it dropped that prompt as well. Its Privacy Sandbox blog said Google had "made the decision to maintain our current approach to offering users third-party cookie choice in Chrome, and will not be rolling out a new standalone prompt for third-party cookies".
Users choose in Chrome's Privacy and Security Settings, as before.
Then in October 2025 Google retired most of the Privacy Sandbox itself. The list published that month includes Topics, Protected Audience, Private Aggregation, Related Website Sets and the Attribution Reporting API (application programming interface).
That is the part worth pausing on.
The deadline went away, and so did the standards a lot of measurement roadmaps were being rebuilt around.
What Changed, and What Did Not
The urgency changed. A hard deadline for rebuilding measurement without third-party cookies is gone, and a plan built on that date needs redating rather than abandoning.
The direction did not.
Privacy rules keep tightening whatever Chrome does, and first-party data is still the right investment.
The reason is different, and the difference matters. Collect your own data because it is the only data you control end to end and can join on your own identifiers, not because a browser is about to take the alternative away.
Use this chart — embed code and citation
<a href="https://neerajjivnani.com/blog/marketing-analytics/"><img src="https://neerajjivnani.com/infographics/marketing-analytics/cookie-timeline.png" alt="Timeline of Google's published decisions on third-party cookies and the Privacy Sandbox, showing July 2024 when the deprecation was abandoned and a choice experience in Chrome proposed instead, April 2025 when the standalone prompt was dropped and the current approach maintained, and October 2025 when Topics, Protected Audience, Private Aggregation, Related Website Sets and the Attribution Reporting API were retired, with the current state stated as third-party cookie choice remaining in Chrome's Privacy and Security Settings." width="1200"></a>
<p>Chart: <a href="https://neerajjivnani.com/blog/marketing-analytics/">Neeraj Jivnani</a></p>Neeraj Jivnani, "Marketing Analytics: What It Covers, and Why Measuring Is Not the Same as Deciding", neerajjivnani.com, https://neerajjivnani.com/blog/marketing-analytics/Free to republish with a link back to this page.
AI in the Reporting Stack, Measured Rather Than Promised
The reporting stack has an AI layer now, and it is the layer teams lean on least.
At 26% top-tier reliance, AI-based reporting sat last of the four when the April 2026 survey fielded, between July and November 2025.
It is also the only one of the four that a slice of respondents said they do not use at all.
The report's own summary calls AI-based analytics "starting to appear but not yet embedded", which is a description of adoption rather than a verdict on the tools.
Our reading is that the tool changed and the constraint did not. None of the nine facts separating the advanced teams is a tool problem.
An AI layer sitting on unjoined data with no governance produces faster answers to questions nobody can trace a decision to.
The teams that get the most from it will be the ones that already had the boring parts working. If you are choosing between an AI reporting layer and a quarter spent joining your customer records, join the records.
One Question, Worked Through End to End
Here is a single question taken from data source to decision, on numbers small enough to check by hand.
Say a company sells one product through three channels: paid search, email and organic search. Twelve sales close in a month.
The first problem is the source. Each channel's platform reports what it drove, and each one counts a sale it touched at all.
Add the three platform reports together and they claim more than twelve sales between them. That is the arithmetic every team meets in its first month, and it is why platform metrics leading reliance at 41% is a fact about convenience rather than accuracy.
Then Pick a Rule for Assigning Credit
So pick an attribution rule. Under last-touch, the channel used immediately before the purchase takes the whole sale: say paid search takes eight of the twelve and email takes four.
Organic search, which every buyer touched, takes none.
Now split the credit evenly across every channel a buyer touched. Say all twelve buyers touched all three, so each channel takes four.
Paid search is credited with eight sales under one rule and four under the other. Nothing about the company changed between the two readings.
The decision goes a different way depending on which rule you picked. Under last-touch, paid search is the obvious place to put more money and organic looks like it did nothing.
Under even splitting, no channel stands out.
One month, two credit rules
The worked example above is loaded by default. Put your own month in instead: how many sales closed, which channel was last before each purchase, and how many of those sales each channel appeared in anywhere. Nothing about the month changes between the two columns. Only the rule does.
| Channel | Last touch on | Appeared in | Last-touch credit | Split by appearances |
|---|---|---|---|---|
| Paid search | 8 | 4.0 | ||
| 4 | 4.0 | |||
| Organic search | 0 | 4.0 |
What the two rules say about the same month
Paid search is credited with 8 sales under last touch and 4.0 when the credit is split by how often each channel appeared. That is a gap of 4.0 sales, and nothing about the month changed between the two readings.
The second column is your appearance counts scaled to your own sale count, which is one way of splitting credit and not the right answer. Neither column is. The decision that matters is which rule you are going to keep using, made once and on purpose, rather than inherited from whichever report opened first.
That is marketing analytics as a working practice rather than a definition. The data source, the credit rule and the decision are three separate choices, and 21% of surveyed teams are making the second one by default.
Why the Tool Is the Last Decision, Not the First
Build in this order, which puts the tool at the end rather than the start. Every difference in that nine-row table sits above the tool layer.
- Write down the decision you want to change. Not a metric, a decision: where next quarter's budget moves, which segment gets the new offer. A measurement plan with no decision attached produces a dashboard nobody opens.
- Set goals and benchmarks before the data arrives. A number with nothing to be measured against is a number somebody will argue about later.
- Name who owns it. 62% of companies put the chief marketing officer (CMO) in charge of the measurement roadmap, against 12% naming a chief data or analytics officer. Somebody has to hold it, and it is a different job from running the tool.
- Put governance in before scale. It is unglamorous, it is the input to data trust, and it is the step nobody sells you.
- Join the data. Only 20% have it fully unified, and nothing above this line survives contact with a customer who exists three times.
- Then choose the tool. By this point you know what question it has to answer and what data it will read, which is the only way to judge one.
Doing this in the reverse order is the common failure and it is expensive rather than fatal. You end up with a working dashboard that reports three versions of the same customer.
Is Marketing Analytics a Job, or a Queue?
Before you plan a career or a hire around it, the first thing worth knowing is that this is often not a job at all.
21% of companies reach advanced analytics and data science through a dedicated team, in the April 2026 survey. 48% get it through shared services, and 28% get limited access that way.
So for roughly three quarters of these organizations, marketing analytics is a queue rather than a colleague. That changes what you are asking for when you ask for analytics support.
Does Marketing Analytics Pay Well?
The pay answer is harder to give than it should be, and the reason is real. There is no Bureau of Labor Statistics occupation called marketing analyst, so any number you see is standing in for something else.
The closest published occupation is market research analysts.
The lowest 10 percent of them earned less than $43,390 and the highest 10 percent more than $155,480, in Bureau of Labor Statistics wage data for May 2025.
That spread is the honest answer to whether this pays well. It depends more on where you land than on the field you picked.
The scarce thing is not the analysis. The teams the survey calls advanced are the ones with governance, joined data and shared ownership with finance.
That is a measurement of companies rather than of careers.
Governance, joined data and shared ownership are each a negotiation before they are a technique.
The Difference Between a Report and a Decision
A report says what happened. A decision says what changes because of it, and the evidence says the second one is much rarer than the first.
Only 29% of senior marketers can point at a decision their data produced. That is the outcome the rest of the machinery exists to reach.
Getting into that group is a sequence, and none of its steps is a purchase.
The one that moves the most for the least effort is choosing a credit rule on purpose, so that two honest people reading the same month stop reporting different winners.
The tool comes last, and it comes cheap by comparison.
The two questions worth taking away are small and neither is about software. Which decision would you make differently next quarter if the measurement were perfect, and who in the company would have to agree with it?
If the first has no answer, the measurement has nothing to change. If the second names somebody outside marketing, that is the conversation the advanced teams had first.