What a Churn Rate Is, How to Calculate It, and What It Counts
Churn is the share of customers you lost over a period. Get the formula, the monthly to annual conversion, and what a benchmark has to carry.


/ On this page9 sections
A churn rate is the share of customers, subscribers or revenue lost over a period: the number that left, divided by the number you started with.
On its own that percentage tells you nothing. What makes it readable is what travels with it: the period it covers, the base it is a rate of, and what each half of the fraction leaves out.
Change one of those three and one business can publish two correct churn rates for the same three months, with one coming out nearly twice the other.
What a Churn Rate Measures, and Which Businesses It Fits
A churn rate is the arithmetic complement of retention. Subtract a retention rate from 100 and you have the churn rate for the same base over the same period.
The metric fits some businesses far better than others. It is widely applied where the customer base is contractual: telecommunications, subscription media, software as a service, utilities.
Those businesses have a cancellation event. Somebody stops paying on a stated date, and the count of who left is a fact rather than a judgment.
A shop has no such event.
A customer who has not ordered since March may be gone, or may be back next week. Before you can measure churn at all you have to choose an inactivity window and say what it is.
That is why an e-commerce churn figure and a subscription churn figure are not the same kind of number, even when both are printed as a percentage. One counts cancellations. The other counts silence, for a length of time somebody picked.
The reason to track it is the comparison with growth. New customers have to arrive faster than existing ones leave, or the base shrinks whatever the acquisition numbers look like.
Neither rate means anything against the other until both are measured over the same period.
The Same Word Also Names Staff Turnover
Churn rate is also used for employees, the same fraction with headcount in place of customers: leavers during the period, over the headcount at the start.
The word itself marks neither one. Which noun it belongs to changes the base, who owns the number, and every action you would take on the back of it.
If you have been handed a churn number with no noun attached, that is the first thing to settle.
The Formula, and Why the Numerator Is Not a Subtraction
Churn rate is the number of customers lost during the period, divided by the number of customers at the start of the period, times 100.
The numerator is a count of departures, and that is the half that goes wrong.
Exclude anyone who arrived during the period, and exclude the recurring revenue they brought with them. Someone who joined after the clock started was never eligible to be counted as lost.
Put numbers on it. A business enters January with 900 existing customers, acquires 50 new ones during the month, and loses 30 of the original 900. The monthly churn rate is 3.33%, on ChurnZero's own worked month.
Now compute the numerator as a subtraction instead.
The month ended with more customers than it opened with, so beginning minus ending is a negative number, and the 30 who left have disappeared from the arithmetic entirely.
The subtraction can never come out above the count, because the arrivals are taken off the top of the fraction.
So it understates churn in every month somebody signed up, and the two agree only where nobody did. The faster you grow, the more it hides.
The shortcut is common enough to be worth checking on any churn number you are handed, including your own. Ask whether the top of the fraction is a count of departures, or the difference between two headcounts.
The Denominator Is a Choice As Well
The usual base is the customer count at the start of the period. It is not the only defensible one.
One alternative divides by the number of customers acquired during the same period rather than by the whole base. That answers a different question, about how well new business sticks, and it produces a different percentage from the same events.
A third base is the average of the counts at two period ends, which smooths the distortion you get when the base moves a lot inside the period.
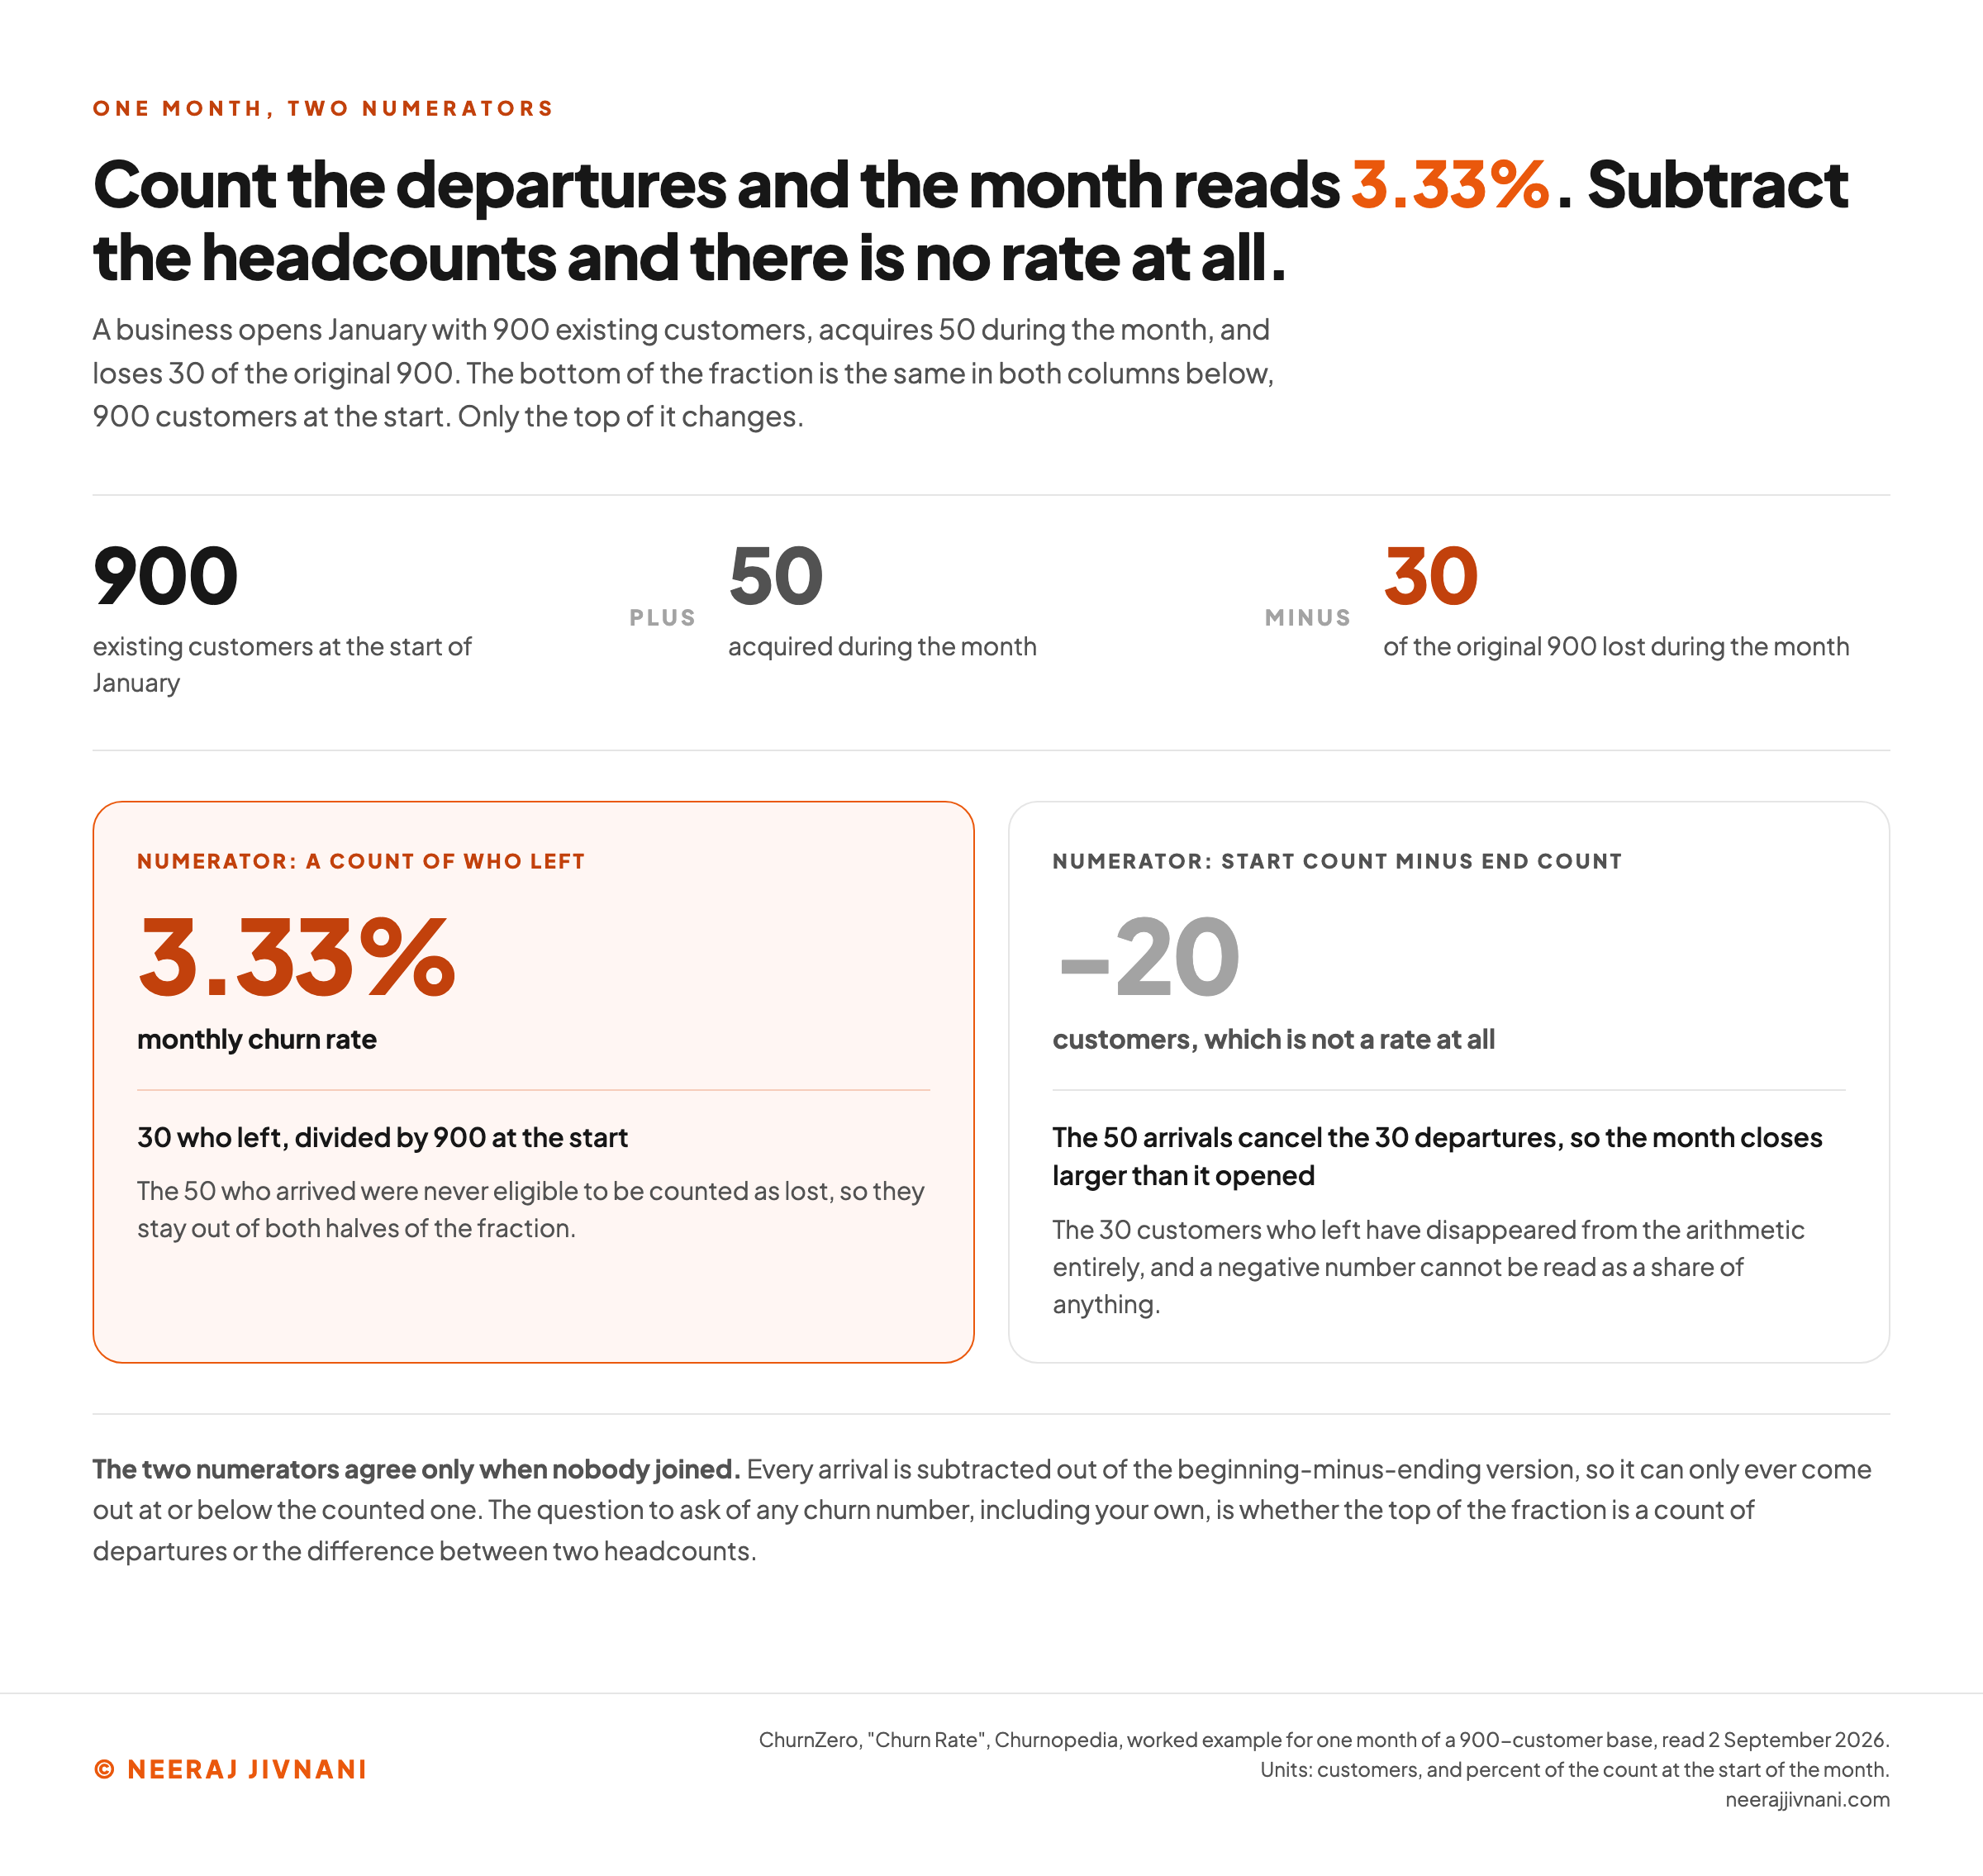
Use this chart — embed code and citation
<a href="https://neerajjivnani.com/blog/churn-rate/"><img src="https://neerajjivnani.com/infographics/churn-rate/two-numerators.png" alt="Side by side calculation of one month of subscriber movement, 900 customers at the start, 50 acquired and 30 lost, showing that the counted numerator gives a churn rate of 3.33% while the beginning minus ending numerator gives minus 20 customers and no usable rate, because the 50 arrivals cancel out the 30 departures." width="1200"></a>
<p>Chart: <a href="https://neerajjivnani.com/blog/churn-rate/">Neeraj Jivnani</a></p>Neeraj Jivnani, "What a Churn Rate Is, How to Calculate It, and What It Counts", neerajjivnani.com, https://neerajjivnani.com/blog/churn-rate/Free to republish with a link back to this page.
One Name, Four Different Measurements: Customers, Revenue, Gross and Net
Churn rate names at least four measurements, and knowing which one you are holding matters more than the number itself.
The first split is customers against revenue. Customer churn counts departures, and revenue churn measures the money that left with them, which is a different quantity whenever your customers are not all worth the same.
The gap runs both ways, and ChurnZero's worked January shows it. The customer churn rate is 3.33% while the monthly recurring revenue churn rate is 4.44%, because the 30 customers who left were higher payers than average.
Those 30 departures took $1,200 out of $27,000 of monthly recurring revenue, so the revenue rate is a third higher than the headcount rate for the same month.
The gap inverts in ChurnZero's annual example. Losing 150 of 500 customers is 30% customer churn, but those accounts were the smaller ones, so the annual recurring revenue churn rate is 18%.
There the departures cost $1,800,000 out of $10,000,000. A business reading only the customer rate would have written off a year that was, in revenue terms, a good deal better than it looked.
Neither figure is the truth on its own.
The second split is gross against net. Gross revenue churn is what a period lost to cancellations and downgrades.
Net revenue churn is the same figure with upgrades and expansions from existing customers netted off.
Net can go below zero, and that is the whole meaning of negative churn: expansion revenue from existing customers exceeding the revenue lost to churn and downgrades.
Watch the term, because it is also used for a customer count that grew. A fraction of departures over a starting base cannot go below zero, so that is a different claim wearing the same words.
Adjusted and Seasonal Churn, Written Out
Two variants get named often enough to be worth having as text rather than as folklore.
The adjusted churn rate is written as lost customers minus new customers acquired, divided by total customers at the start, times 100.
Follow that as written and any growing business has a negative adjusted churn rate, which is not a churn rate at all. It measures net movement in the customer base. Know that before you quote somebody's adjusted figure.
Seasonal churn is the same fraction inside a chosen window: customers lost in a season, divided by customers at the start of that season, times 100. It earns its place where cancellations cluster after a holiday or a fiscal year end.
Monthly or Annual: Why 20% Is Two Different Answers
A monthly churn rate does not become an annual one by multiplying by twelve.
Each month's losses come out of a base the previous month already shrank, so the right operation is compounding. Annual churn is 1 minus (1 minus the monthly churn rate), raised to the twelfth power.
Two percent monthly churn annualized is 21.5%. Multiplying 2.0% by twelve gives 24%, which is the shortcut most people reach for and it is too high.
Here is the rest of the conversion, as WallStreetPrep publishes it.
| Monthly churn rate | Annual churn rate |
|---|---|
| 1.0% | 11.4% |
| 2.0% | 21.5% |
| 3.0% | 30.6% |
| 5.0% | 46.0% |
| 10.0% | 71.8% |
| 15.0% | 85.8% |
Count the periods carefully, because one month changes the answer. Compounding 5.0% monthly over twelve months gives the 46.0% in the table. Over eleven months it gives 43.1%, which is what WallStreetPrep's own January to December example reports.
The same conversion answers what a 20% churn rate means. Nothing, until you say over what and over how long.
If it is 20% a year on customers, the average customer life is five years, because customer lifetime is the inverse of the churn rate. Run that the other way and 2.0% monthly implies a lifetime of 50 months.
If it is 20% a month, the compounded annual figure runs off the top of the table above, where 15.0% monthly is already 85.8% a year.
One number, one unit apart, and two completely different businesses.
A rate of what, over how long, less what
Put in the churn number you are about to quote. It stays unreadable until the three questions below are answered, so this writes back the line you could publish beside it, and the readings still open where an answer is missing.
1. The period it covers
2. The base it is a rate of
What the percentage counts:
What it is divided by:
3. What each half of the fraction leaves out
The top of the fraction is:
Tick anything you could put in writing today:
The line you could publish beside it
20% of what? over what period?, counted how? over what base?.
Still open, so still unreadable (7)
- Read as a monthly rate, 20% compounds to 93.1% a year. Read as an annual rate it is 20%. Those are two different businesses behind one number.
- Customer churn and revenue churn are different quantities whenever your customers are not all worth the same, and they can move in opposite directions in the same period.
- The top of the fraction is where this goes wrong. Until you know whether it is a count of departures or a subtraction, the rate cannot be trusted in either direction.
- The usual base is the count at the start of the period, and it is not the only defensible one. Each of the three answers a different question and produces a different percentage from the same events.
- Nobody has said whether the arrivals were excluded. Someone who joined after the clock started was never eligible to be counted as lost.
- Nobody has said what the base leaves out, so the population behind the percentage is unknown.
- Nobody has said how a rejoin is treated. A rate that counts every departure overstates itself where customers leave and come straight back.
Nothing here says whether your rate is good, and no benchmark is applied to it. That comparison is with your own last cohort at the same age, on this same definition, which is the only pair where both sides are measuring the same thing.
Averaging Twelve Monthly Rates Is Not the Annual Rate
There is a third quantity hiding in the word average, and it is easy to state one while meaning the other.
An average churn rate is the rate for each period in the window, averaged across the window. That gives you the typical month.
It does not give you the share of the base lost across the year, which is what compounding produces, and the two numbers separate further the higher the rate goes.
Say which one you mean when you report it. This is the mean of twelve monthly rates, or this is the compounded annual rate. Only one of them belongs next to an annual benchmark.
Voluntary, Involuntary, and Which Number Points at Which Fix
One part of your churn is a customer decision and the other is a payment failure, so split the rate before you try to move it.
Voluntary churn is a cancellation someone chose. Involuntary churn is a subscription that lapsed because a recurring payment failed, which is not a loyalty signal at all.
Average voluntary churn runs at 4.0% against average involuntary churn at 1.4% in Recurly's 2022 customer data, and the same page puts 53% of total churn down to failed payments.
Read that against a headline rate and the direction of the work changes. If half of your churn is expired cards and declined transactions, the lever is in billing and retry logic, and no amount of product work will find it.
Some of It Is a Payment System, Not a Product
There are over 2,000 reasons a card can be declined, by Recurly's count.
Expiry, a changed number, a bank's fraud rule and an issuer's daily limit all end a subscription the customer meant to keep, which puts the involuntary share in payment infrastructure rather than in the relationship.
So the decomposition is the honest answer to how to reduce it. A churn rate is an aggregate, and the only thing an aggregate can tell you is which of its parts is big enough to be worth attacking.
Report two numbers rather than one. A voluntary rate that is moving tells you something about the product or the price, and an involuntary rate that is moving tells you something about payment infrastructure.
Those three figures, the 4.0%, the 1.4% and the 53%, need one caution before you carry them anywhere. They are published with no period attached to any of them, so putting them beside a dated annual figure means supplying an assumption rather than reading one.
The two readings of the involuntary share do not agree either. Against a voluntary 4.0%, an involuntary 1.4% is about a quarter of the total, and the 53% is about half.
Neither reading says which population it is drawn from, and that is the label that would settle which of them applies to you.
Four Churn Rates, Two Filers, One Quarter
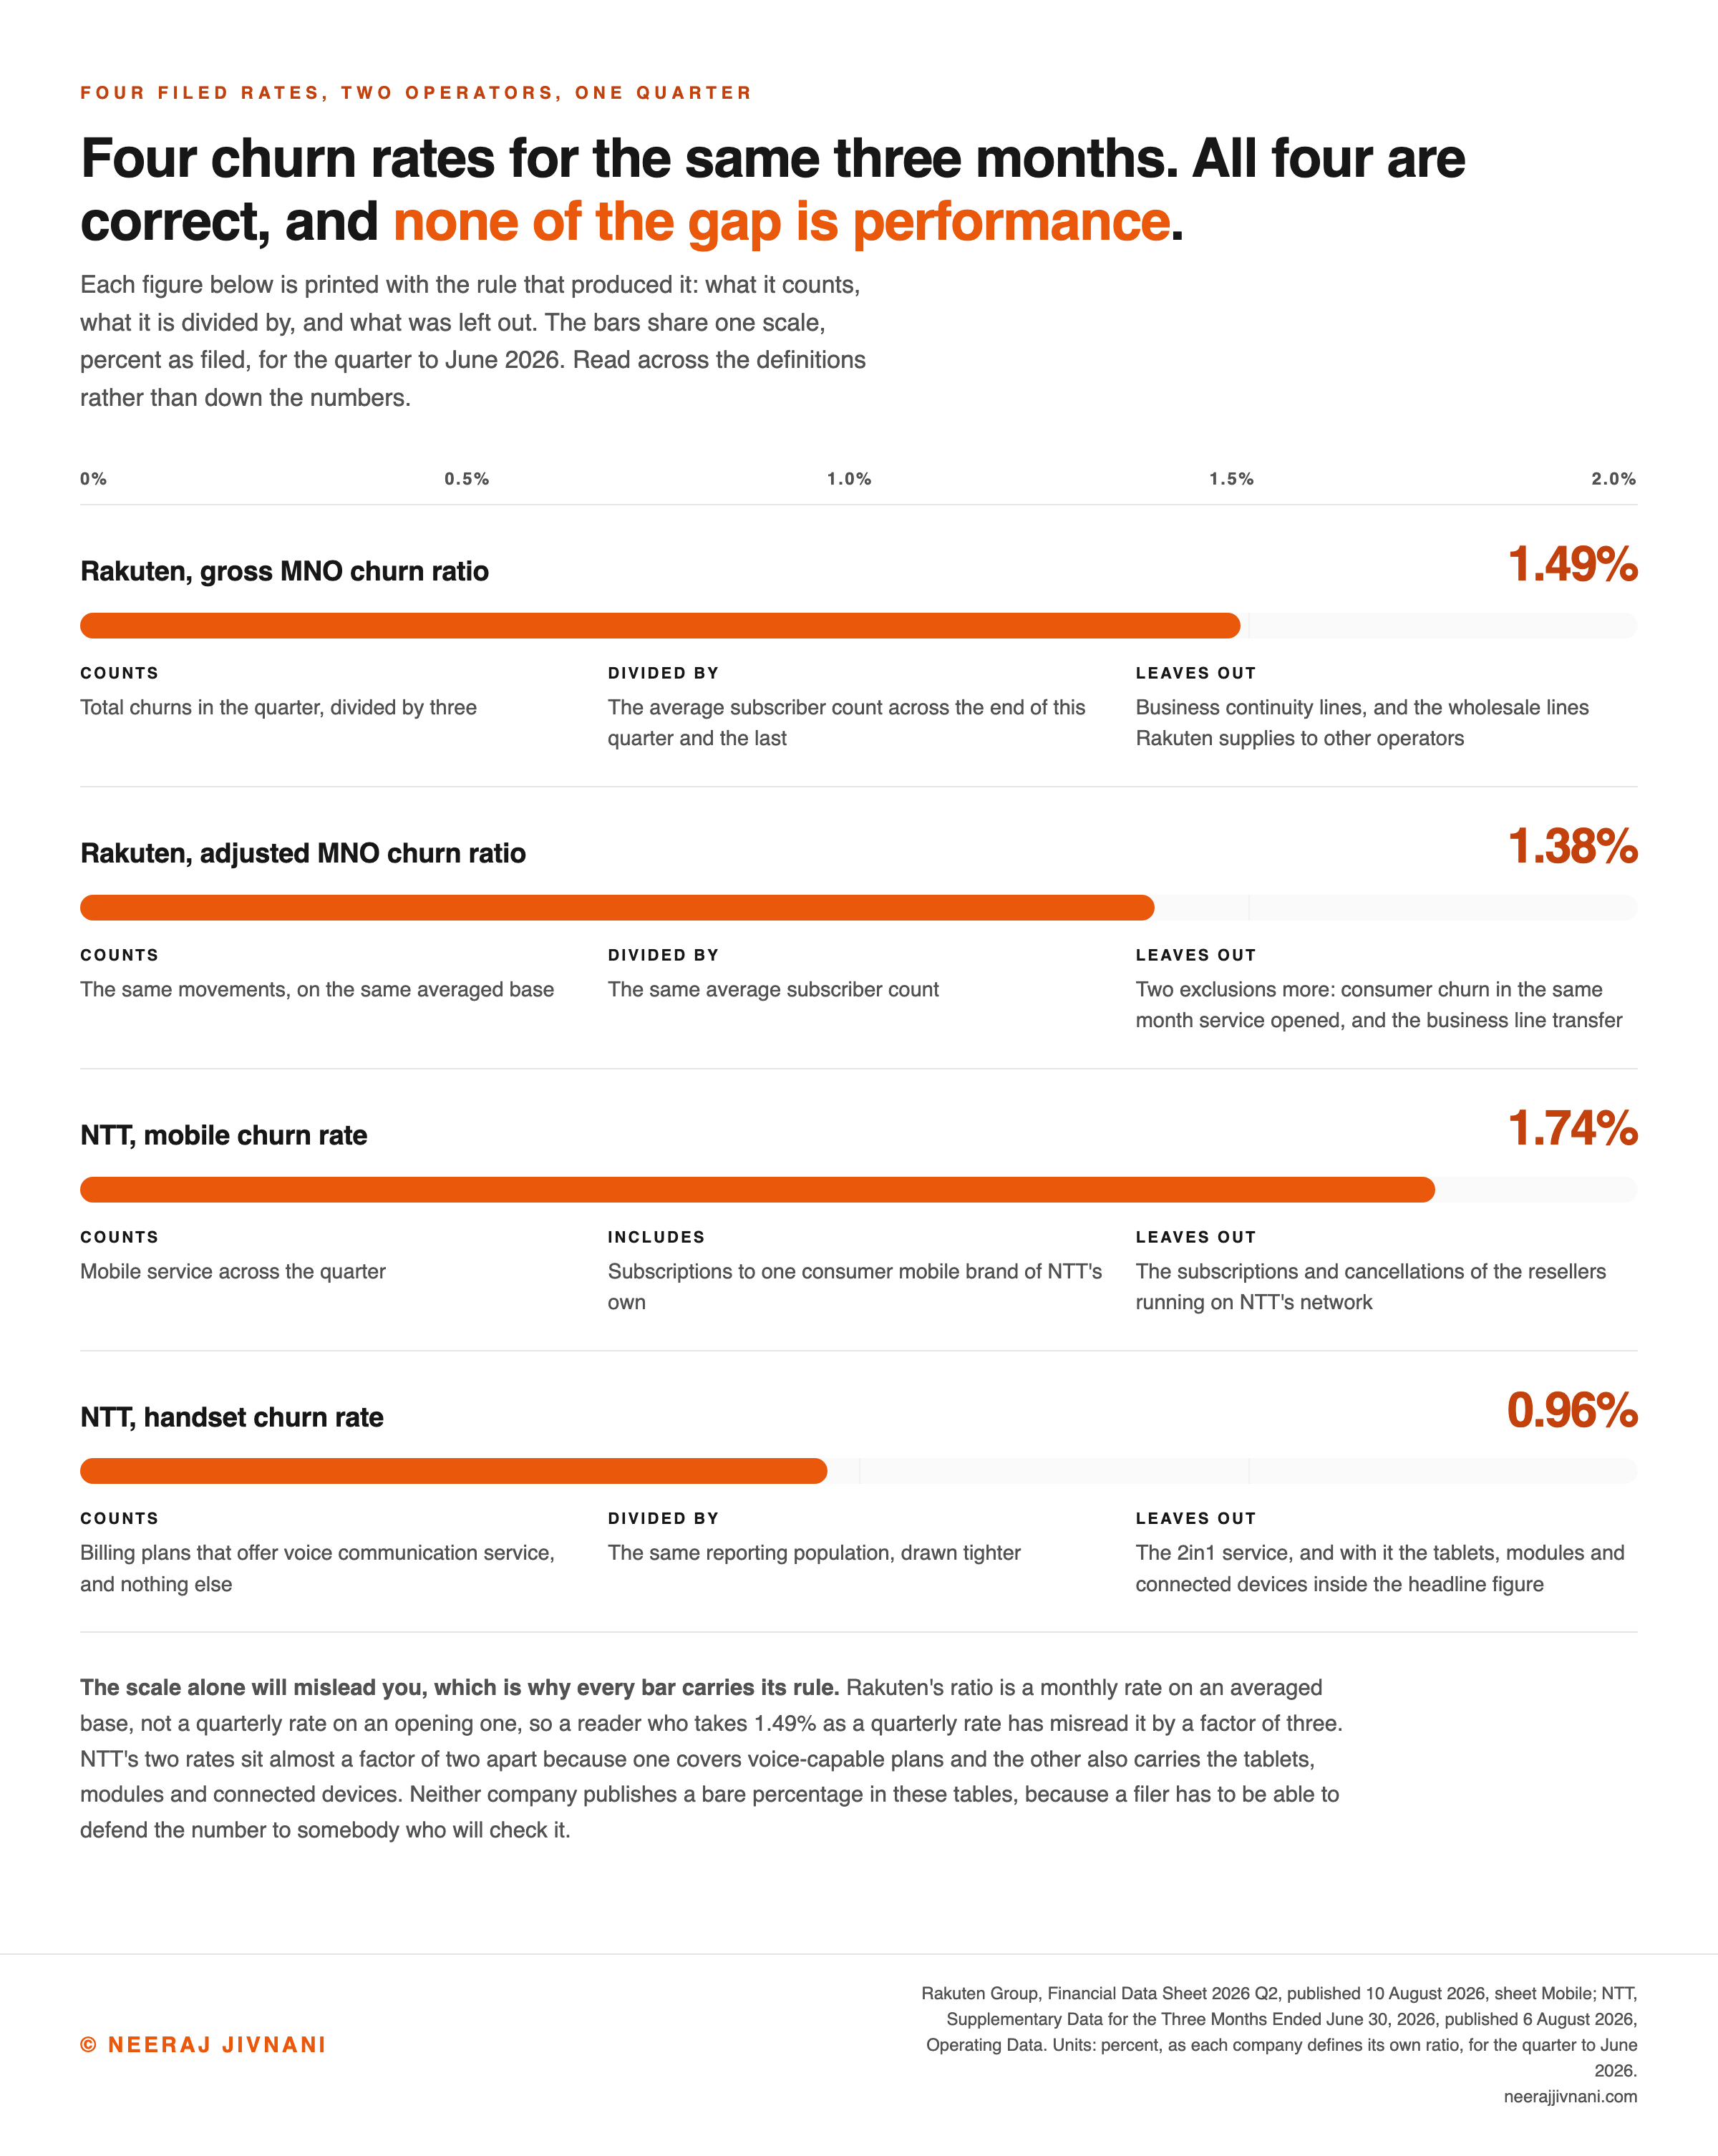
Two listed telecoms each published two different churn rates for the same business in the quarter to June 2026. All four are correct, and each one arrives with the rule that produced it.
Rakuten's data sheet for that quarter carries a gross churn ratio of 1.49% and an adjusted churn ratio of 1.38% for its mobile network operator (MNO) business, for the same subscribers.
The sheet then defines the ratio rather than leaving you to guess: total churns in the quarter, divided by three, divided by the average subscriber count across the end of that quarter and the end of the previous one.
Read plainly, 1.49% looks like the share of subscribers who left over three months. It is a monthly figure, on a base averaged across two quarter ends, so about three times that share left across the quarter.
The population is narrowed too, because the sheet excludes business continuity lines and the mobile virtual network enabler (MVNE) lines Rakuten wholesales to others.
Three choices, none of them the one the standard formula assumes, and each of them moves the answer.
Two exclusions separate the adjusted figure from the gross one, and the sheet names both in its own footnote.
One is churn by consumer customers in the same month their service opened. The other is business churn caused by moving some lines to business continuity, and others after a change in how sales were recorded.
Both are defensible, and both are choices.
The gap between the pair has been far wider.
In the quarter to December 2024 the gross ratio was 2.52% against an adjusted ratio of 1.38%, the same adjusted figure as the June quarter, so one business was reported almost twice as high on the definition alone.
NTT Files Two Rates and Footnotes Both Exclusions
Nippon Telegraph and Telephone (NTT) does the same thing with a different pair, in its supplementary data for the three months to June 2026.
Its mobile churn rate is 1.74% and its handset churn rate is 0.96%, both printed in the same table for the same quarter.
The footnotes carry the difference. The headline rate excludes the subscriptions and cancellations of mobile virtual network operators (MVNOs), the resellers running on NTT's network, while including subscriptions to one consumer mobile brand of its own.
The handset rate is drawn tighter still. It covers only billing plans that offer voice communication service, excluding what NTT calls its 2in1 service.
So every line that cannot make a call sits outside it, including the communication module subscriptions the headline figure counts.
Here are the four, with what each one counts.
| Filer, quarter to June 2026 | Rate | What it counts |
|---|---|---|
| Rakuten, gross MNO churn ratio | 1.49% | All mobile network churns, on an averaged subscriber base excluding business continuity and wholesale lines |
| Rakuten, adjusted MNO churn ratio | 1.38% | The same, less same-month consumer churn and the business line transfer |
| NTT, mobile churn rate | 1.74% | Mobile service, excluding reseller subscriptions and cancellations, including one consumer brand of its own |
| NTT, handset churn rate | 0.96% | Voice-capable billing plans only, excluding the 2in1 service |
Why That Is the Standard Worth Copying
NTT's two rates for one quarter sit almost a factor of two apart, and Rakuten's pair has been wider still. None of that spread is performance. It is what each rate was told to count.
Both filers print the rule beside the rate, because a number that has to survive somebody checking it cannot travel on its own.
Hold your own reporting to the same standard, which costs nothing.
A rate, the count underneath it, the base it was divided by, and a line saying what was left out of each.
Rakuten prints its raw movements too, 435 thousand churns against 818 thousand new openings in the quarter, and that is what makes a rate checkable rather than merely quotable.
Use this chart — embed code and citation
<a href="https://neerajjivnani.com/blog/churn-rate/"><img src="https://neerajjivnani.com/infographics/churn-rate/four-filed-rates.png" alt="Four officially filed mobile churn rates from two telecom operators covering the same quarter to June 2026, showing Rakuten at 1.49 percent gross against 1.38 percent adjusted and NTT at 1.74 percent for mobile service against 0.96 percent for handsets, with the definition, the denominator and the exclusion attached to each figure so that the gap inside each pair is visibly a definition difference rather than a performance difference." width="1200"></a>
<p>Chart: <a href="https://neerajjivnani.com/blog/churn-rate/">Neeraj Jivnani</a></p>Neeraj Jivnani, "What a Churn Rate Is, How to Calculate It, and What It Counts", neerajjivnani.com, https://neerajjivnani.com/blog/churn-rate/Free to republish with a link back to this page.
What a Good Churn Rate Is, and What a Benchmark Has to Carry
There is no single good churn rate, and some of the most quoted ones arrive without the labels that would make them usable.
A target is only a target if it carries a period, a unit and a population.
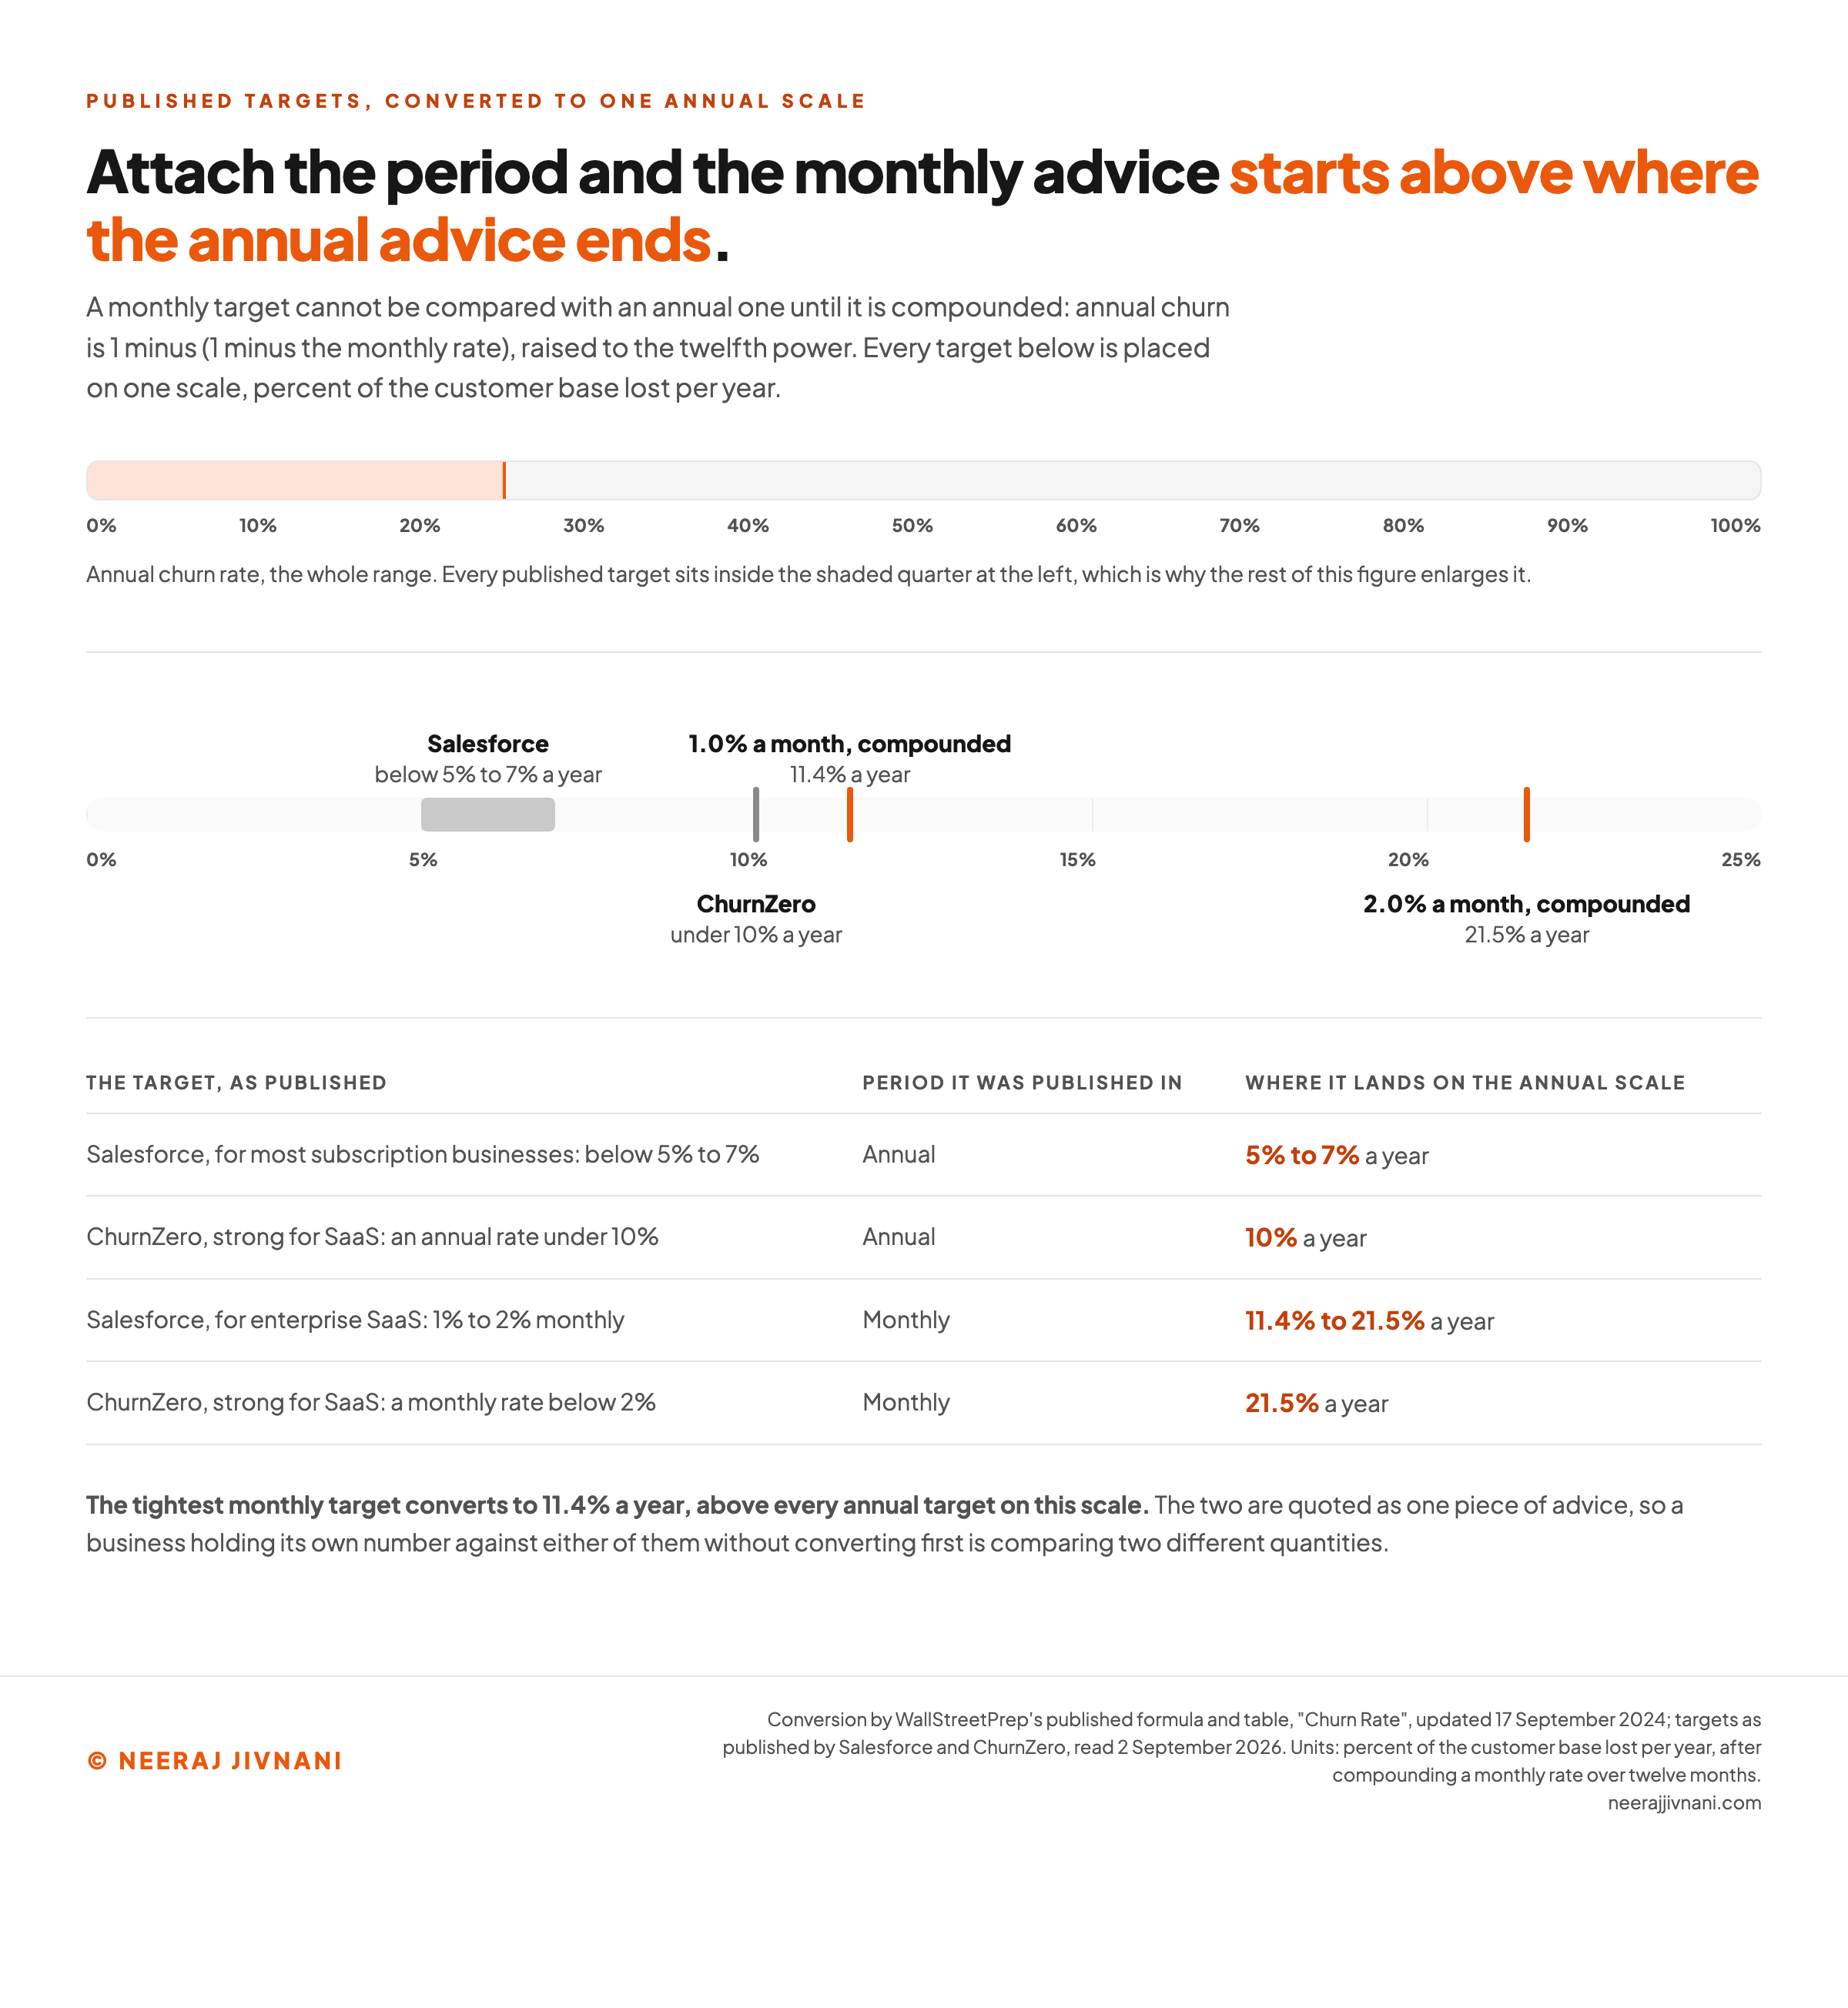
Watch what happens to the common advice once the period is attached. Most subscription businesses aim for an annual churn rate below 5% to 7%, and enterprise SaaS companies often target 1% to 2% monthly, which is Salesforce's published pair.
Put both on one scale using the conversion above. One percent monthly is 11.4% a year and two percent monthly is 21.5% a year, so the monthly half of that advice starts above where the annual half stops.
Below 2% a month, or under 10% a year, is strong for SaaS on ChurnZero's reckoning, and those two thresholds are not the same threshold: 2% a month compounds to 21.5% a year.
Around 5% to 7% for SaaS, at or under 2% for the best performers, and over 8% as the level to avoid: that is Baremetrics' set, with no period on any of the three.
So is a high churn rate bad? Yes, with two real exceptions.
The first is churn concentrated in small or peripheral accounts while the ones carrying the revenue stay.
The second is a cohort acquired through a promotion. Losing the people who were trying the product because it was cheap is not the same thing as losing established customers.
The Rate Moves With the Price Point
Before you judge your rate against anyone's, check what your customers pay.
Recurly's 2022 benchmarks break churn down by average revenue per customer, and the four named bands came out like this.
- Less than $10: 3.4%, the lowest of the four, on the cheapest subscriptions in the set.
- $10 to $25: 5.6%, the second highest, which puts the low-mid price point among the worst performers rather than among the best.
- $50 to $100: 3.8%, close to the cheapest band, and far below the $10 to $25 band that costs less than it does.
- More than $250: 5.9%, the highest of the four, so the most expensive subscriptions churned hardest.
That does not sort by price in either direction, which is the point worth taking from it. A business in the $10 to $25 band and one in the $50 to $100 band are not holding each other's benchmark, whatever a cross-industry average says.
Where the Industry Table Came From
The industry benchmark table you will meet most often turns on four labels, and they decide whether it is your benchmark at all.
The figures are B2B and derived by subtracting a median retention rate from 100, and B2B churn is conventionally measured annually and tracked at the account level rather than the individual user level.
All four are stated on the page they come from, CustomerGauge's State of B2B Account Experience research across 11 B2B industries, published for 2025.
| Industry | CustomerGauge 2025, B2B, annual, account level |
|---|---|
| Energy and utilities | 11% |
| IT services | 12% |
| Computer software | 14% |
| Industry services | 17% |
| Financial services | 19% |
| Professional services | 27% |
| Telecommunications | 31% |
| Manufacturing | 35% |
| Logistics | 40% |
| Consumer packaged goods | 40% |
| Wholesale | 56% |
That is the complete set rather than a selection from it. It runs from 11% to 56%, so which row you belong in matters more than where you sit inside it.
Professional services at 27% is the derivation in plain sight: a median customer retention rate of 73%, subtracted from 100.
Read that way, the number is a statement about surveyed accounts over a year, which is narrower and more useful than an average churn rate for consulting.
Before you hold your own number against a row in a table like that one, check that the row is measured on your period, your unit and your population, because the copy in front of you may not say.
The honest way to answer whether yours is good is to stop looking sideways. Compare a cohort against the cohort before it at the same age, on your own period and your own unit, and the definition is identical on both sides by construction.
Use this chart — embed code and citation
<a href="https://neerajjivnani.com/blog/churn-rate/"><img src="https://neerajjivnani.com/infographics/churn-rate/one-scale.png" alt="A single annual percentage scale from zero to one hundred with published churn targets placed on it after conversion, showing that a one percent monthly target lands at 11.4 percent a year and a two percent monthly target at 21.5 percent a year, while the widely quoted five to seven percent annual target sits far below both, so the same advice points at two different places depending on the period attached to it." width="1200"></a>
<p>Chart: <a href="https://neerajjivnani.com/blog/churn-rate/">Neeraj Jivnani</a></p>Neeraj Jivnani, "What a Churn Rate Is, How to Calculate It, and What It Counts", neerajjivnani.com, https://neerajjivnani.com/blog/churn-rate/Free to republish with a link back to this page.
What the Number Cannot Tell You
A churn rate is a lagging aggregate, and there are questions it cannot answer no matter how carefully you compute it.
Growth distortion is one. A high rate in one period can be the previous period's growth arriving late, because the newest customers are the ones most likely to leave.
Read that way the number is reporting your acquisition, not your quality.
Aggregation is another. Measure churn across one fast-growing aggregated base and it comes out lower than the same customers measured as a cohort, because the base counts joiners who have not yet had time to leave.
Only a cohort calculation escapes that, and only a cohort calculation yields a survival rate and an average customer life.
Nothing in a rate distinguishes new customers from long-standing ones either, or a large account from a small one.
The one that bites hardest in practice is the lack of contextual depth. A rate says how much of the base drained and nothing about why, so it can tell you a quarter went badly without telling you where to look first.
Rejoining is counted as leaving. Rotational churn, where a customer cancels and immediately signs up again, is common in prepaid mobile and overstates any rate that counts every departure.
One quarter is also not a company's rate. NTT's mobile churn rate ran at 0.84%, 0.81%, 0.83% and 0.95% across the four quarters of its last financial year and 0.86% for the year as a whole, then printed 1.74% in the quarter to June 2026.
A single quarter against a benchmark tells you almost nothing.
The same quarter against the eight before it tells you whether something changed.
The series is also the only place a definition change shows up. A rate that jumps while the business is steady is worth checking against the definition before it is read as performance, and a filing that publishes what each rate counts is readable on exactly that question.
Predicting Who Leaves Is a Different Job
Churn analysis and churn prediction answer a question the rate cannot touch.
The rate says how much of the base drained. Prediction ranks individual customers by how likely each one is to go, which is modeling work rather than arithmetic.
That work starts where the rate stops, and it needs the customer-level history an aggregate throws away.
Read the Rate With Its Definition Next to It
A churn rate is a fraction, and almost everything that goes wrong with one goes wrong in the definition of its two halves rather than in the division.
So when a churn rate arrives, ask two things before you compare it with anything.
- What is it a rate of, and over what period? Customers or revenue, gross or net, per month or per year. A figure missing either answer cannot be placed next to another figure, and converting between periods means compounding, not multiplying.
- What did each half of the fraction leave out? Which arrivals were excluded from the numerator, which lines were excluded from the base, and whether reactivations were counted twice.
If your own number cannot answer both, that is the work. Write the definition down, publish it beside the rate, and keep it fixed long enough that this quarter can be read against the last one.