What Social Media Marketing Is, and How to Tell Which Platform Your Buyers Are On
Stop guessing which platform your buyers use. Measured US data narrows it fast, and what to post, what to pay for and what to check follow from there.


/ On this page13 sections
Social media marketing is using social platforms to reach people who might buy from you, through posts you publish and ads you pay for. Which platform you choose decides more than anything else you will do here.
Measured US data narrows that question fast, and once it is narrowed, what to post, what to pay for and what to check all get simpler.
You Are Choosing an Audience, Not an App
Pick the one platform whose audience already contains the people you sell to, and leave the others closed until that one is working.
That sounds obvious. It is almost never how the choice gets made.
Accounts get opened because a competitor has one, or because somebody on the team likes the app, or because a platform is large enough that ignoring it feels careless.
A worldwide user count is the wrong input for that decision. It tells you a platform is big, not whether the people who buy from you are on it.
Say a wedding photographer and an industrial parts supplier both open an account on the same day. The app is identical and the useful audience barely overlaps.
What separates these platforms for a business is the audience each one carries, and in what proportion.
One account worked every week for a year beats four opened in a month.
Organic and Paid: The Two Halves
Organic posting earns distribution, and paid advertising buys it. That single distinction explains most of what confuses beginners about this channel.
Both halves happen on social platforms, which is not the same thing as the rest of digital marketing, which only has to appear online.
A banner on a news site is online. Nothing about who sees it depends on what anybody else did, so it is not social.
Organic means you publish something and the platform decides who sees it. You control the message and almost nothing about the delivery.
Paid means you define an audience, set a budget, and the platform shows your material to that audience, such as everyone within ten miles who has looked for a plumber this month. You control the delivery and pay for every unit of it.
The practical difference is predictability. A paid campaign has a delivery date; an organic post has a lottery ticket.
That does not make organic worthless. It makes it a compounding asset with an unreliable schedule, which is a different thing to plan around.
Why Organic Reach Fell
Organic reach for business pages has been falling for over a decade, and this is the one piece of history worth carrying.
Take Facebook, which is where the change is best documented.
A Social@Ogilvy analysis of more than 100 brand pages, published in March 2014, found organic reach had fallen to 6% that February. In 2012, Facebook had allowed brand pages about 16%.
For large pages, those with more than 500,000 likes, reach in February 2014 was 2%.
Two cautions about those figures, and they matter more than the numbers. They are a decade old, and they describe one platform at one moment. That is the moment the model changed, not a current rate.
If you see a present-tense organic reach percentage anywhere, ask when it was measured before you plan around it.
The Platforms, and Who Is on Them
Which Americans are on which platforms has been measured, and the measurement is public.
Everything below describes US adults. If you sell somewhere else, ask the same question of your own market, because these numbers will not answer it.
Who Uses What in the United States
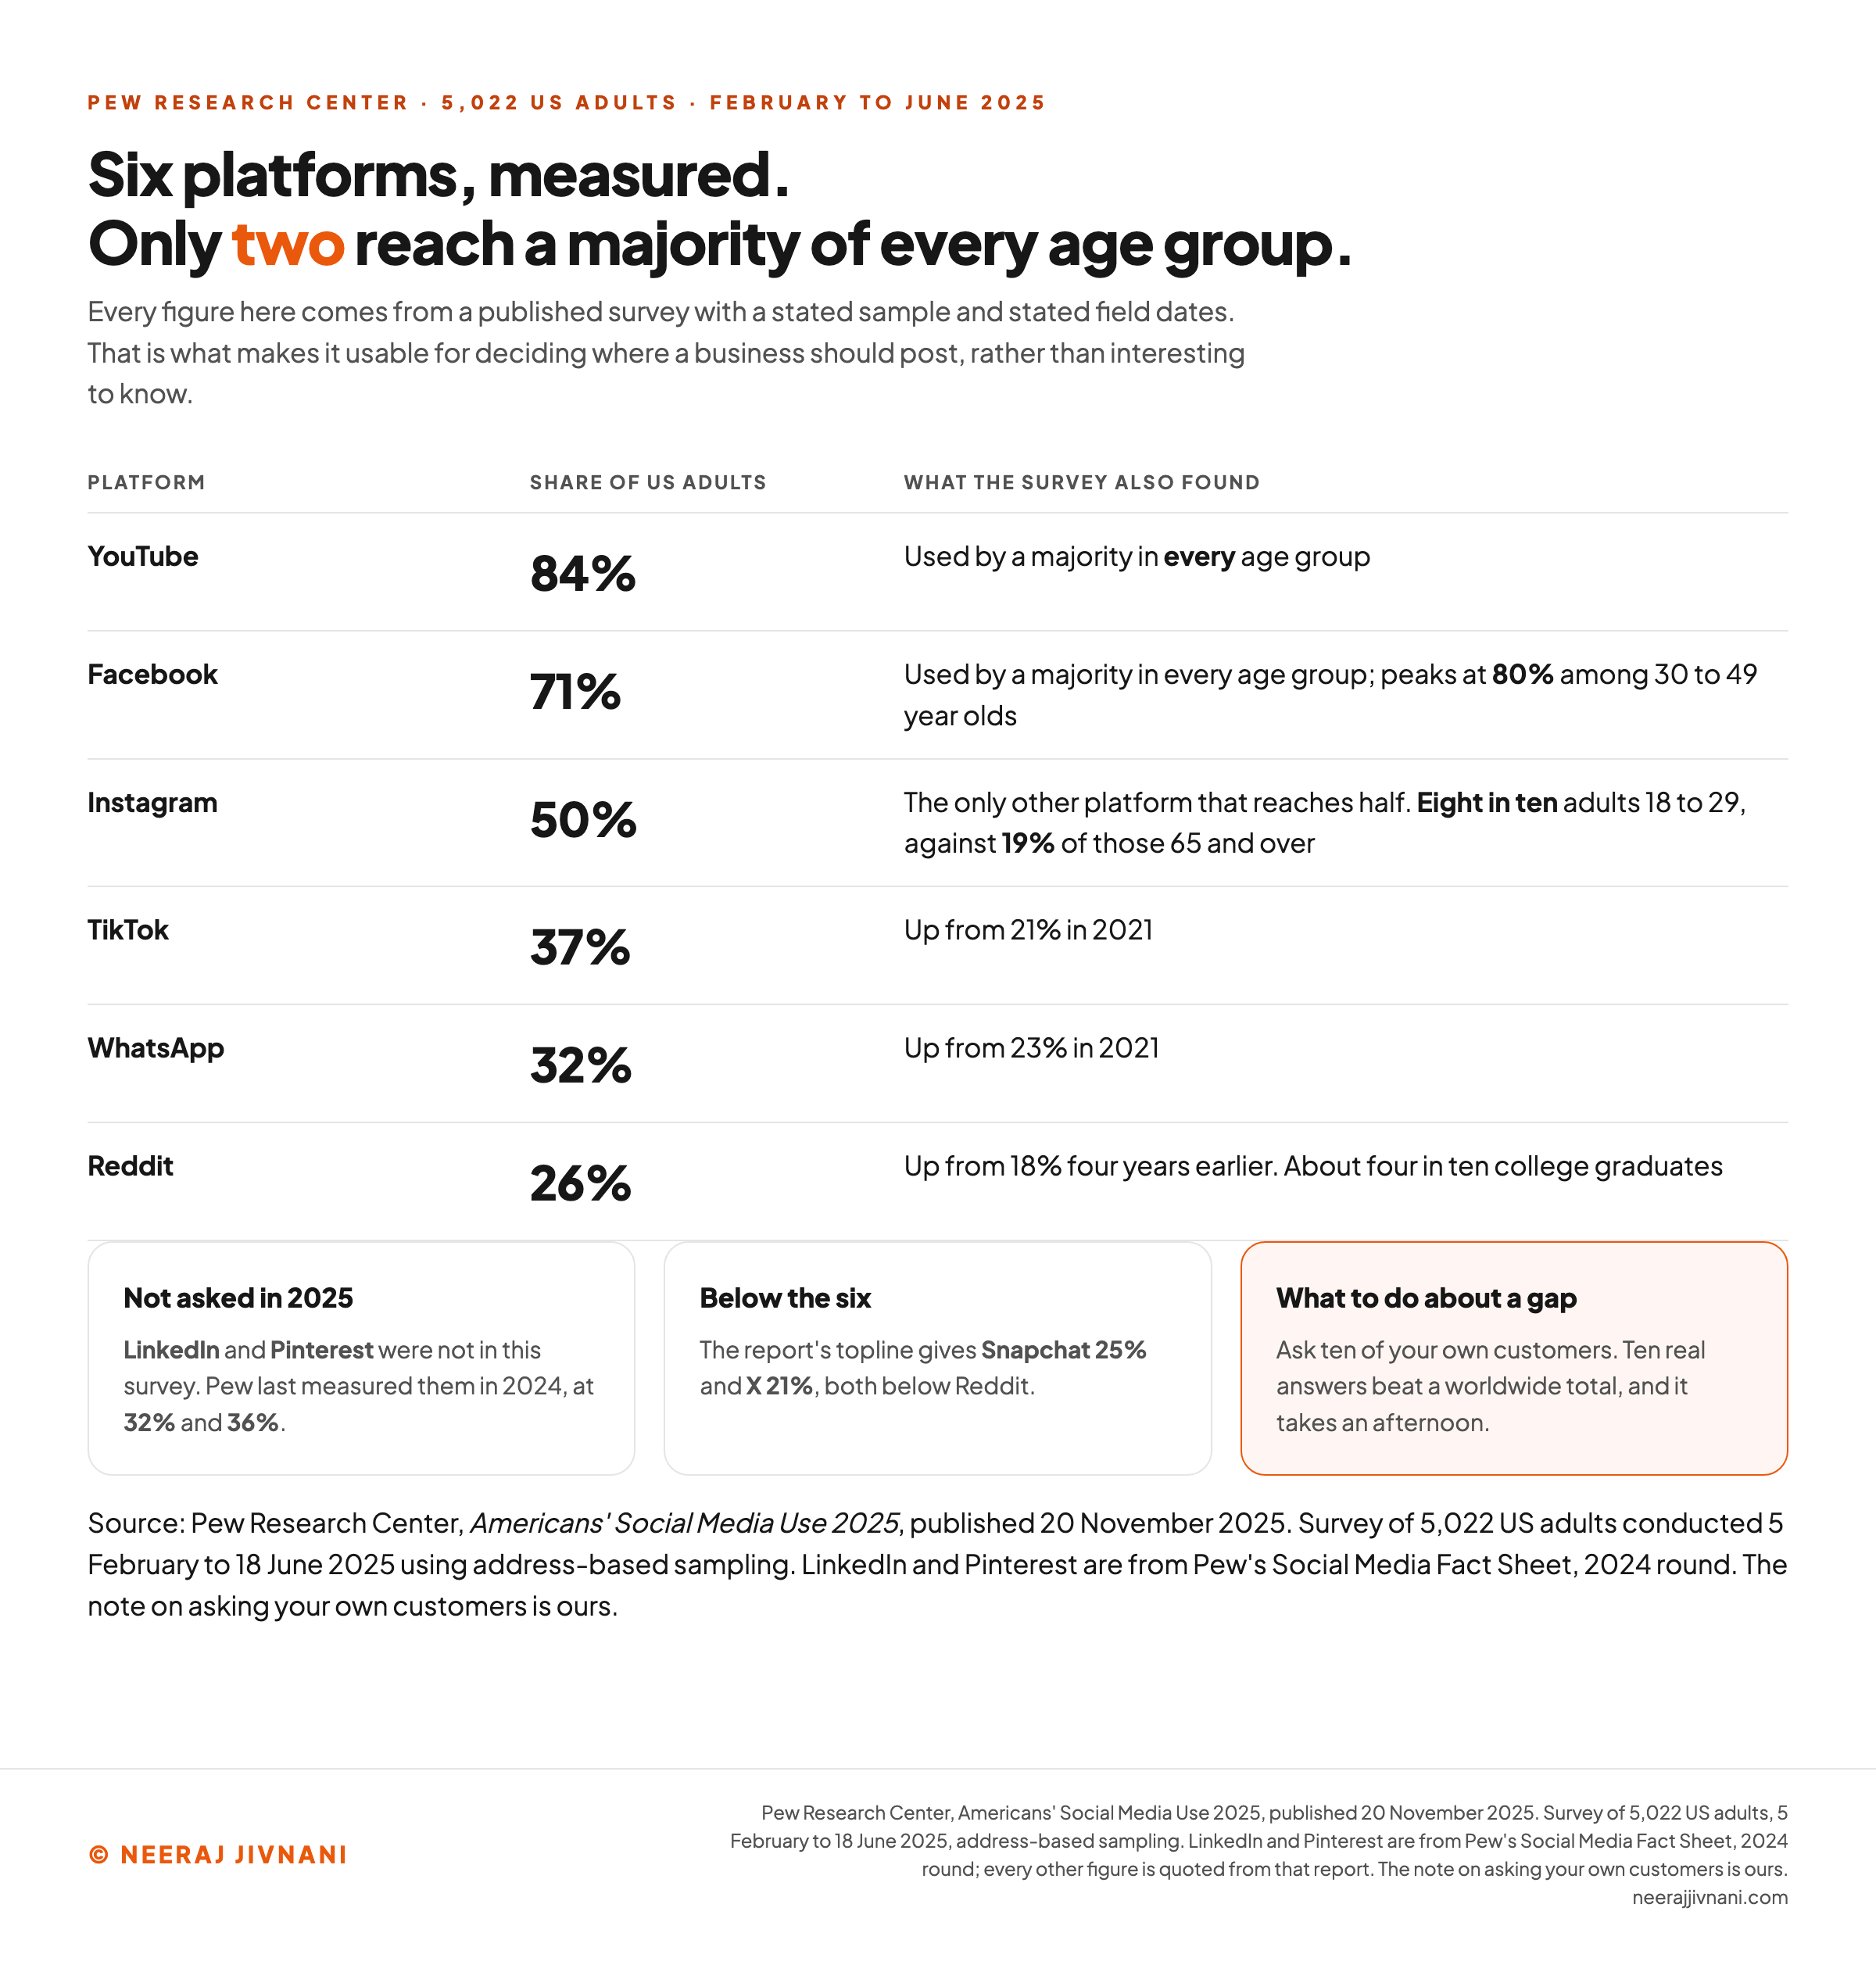
Only three of the six platforms below reach half of US adults or more, and the rest fall away quickly.
The shares below are US adults who say they ever use each platform, measured by Pew Research Center across 5,022 adults surveyed between 5 February and 18 June 2025.
| Platform | Share of US adults | Worth knowing |
|---|---|---|
| YouTube | 84% | The widest reach measured, and used by a majority in every age group |
| 71% | The other platform a majority of every age group uses | |
| 50% | The only other platform that reaches half | |
| TikTok | 37% | Up from 21% in 2021 |
| 32% | Up from 23% in 2021 | |
| 26% | Up from 18% four years earlier |
Threads, Bluesky and Truth Social were each used by about one in ten US adults or fewer.
Read that table as a business rather than as a ranking. The question is not which platform is biggest, it is which one contains the people who buy from you.
Age Moves These Numbers More Than Anything Else
Adults under 30 use most of these platforms more than older adults, and on some the gap is enormous.
Eight in ten adults aged 18 to 29 use Instagram. Among adults 65 and over, the figure is 19%.
Facebook does not follow that pattern. Its heaviest use is among 30 to 49 year olds, at 80%, which is the opposite of the assumption that it is where older people are.
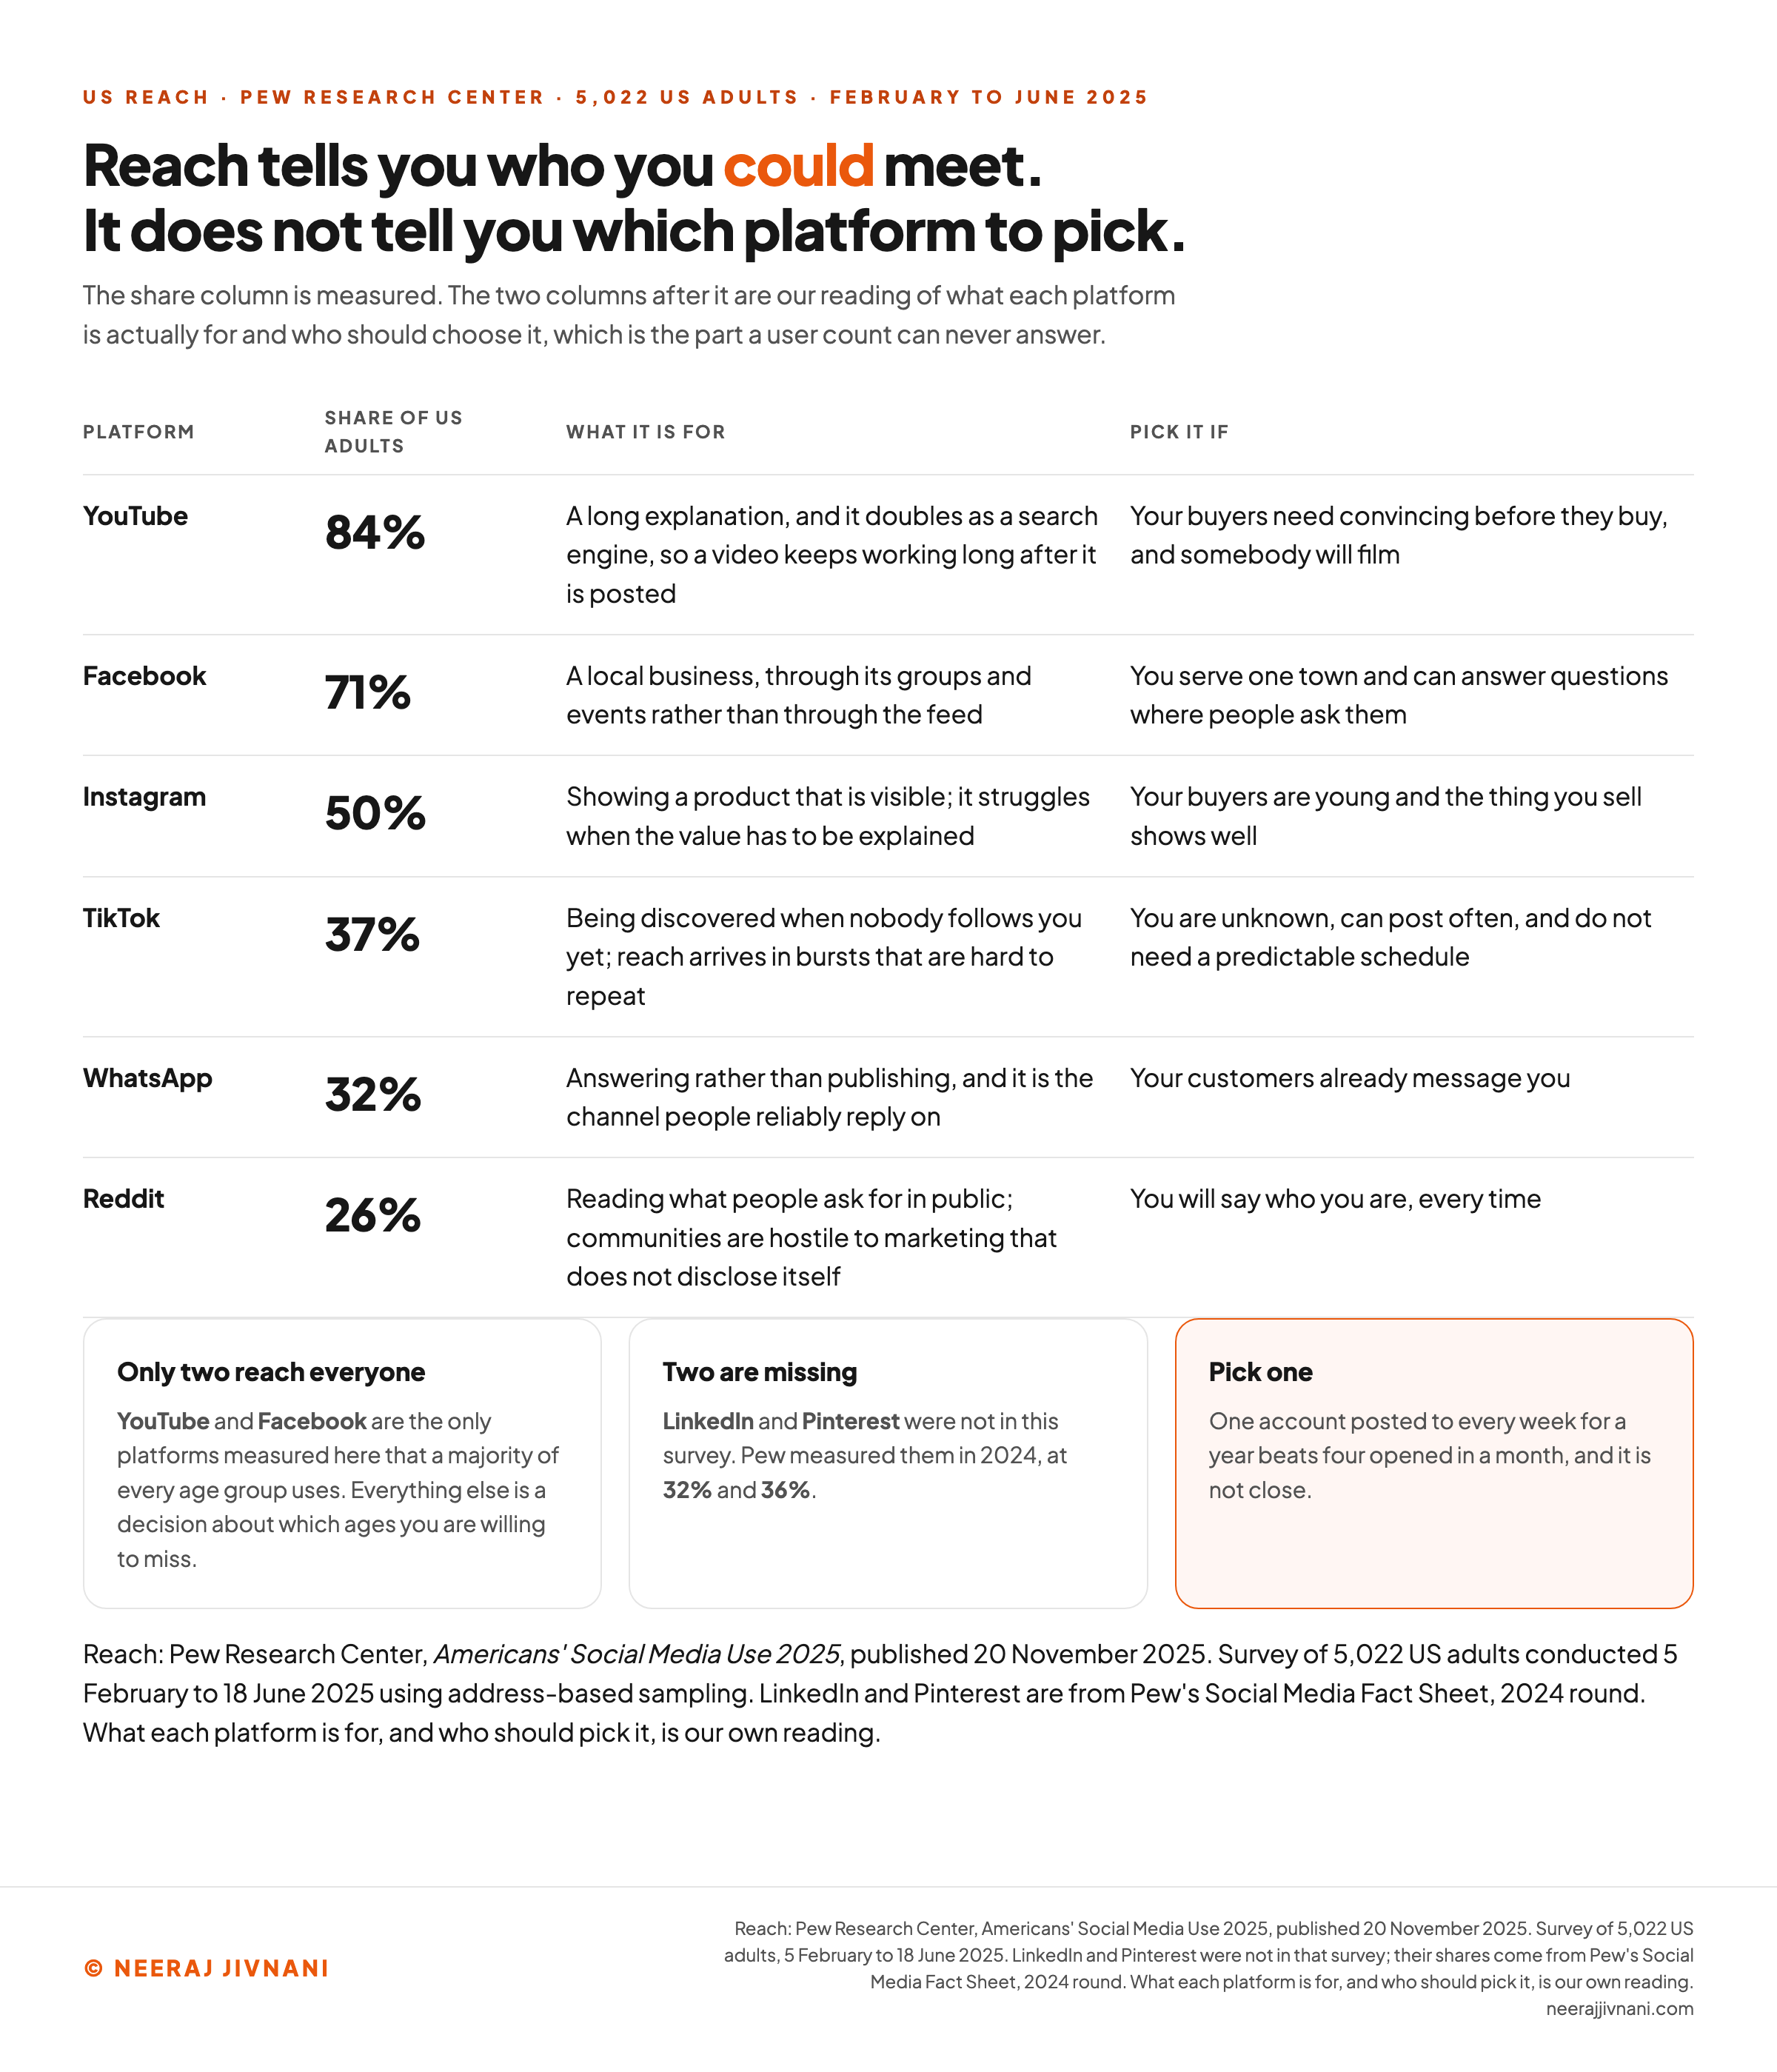
Only YouTube and Facebook are used by a majority of every age group Pew asked about. Every other platform is a decision about which ages you are willing to miss.
What is actually known about reach
Pew Research Center surveyed 5,022 US adults between 5 February and 18 June 2025. Pick who you sell to and see what that survey measured, and what it did not.
Who do you sell to?
The Other Splits Worth Knowing
Gender moves several platforms. More than half of women use Instagram, at 55%, against 44% of men. Men are likelier to use X and Reddit.
Race and ethnicity move them too. 45% of White adults use Instagram, against 62% of Hispanic adults, 58% of Asian adults and 54% of Black adults.
Education moves Reddit, WhatsApp and Instagram, and Reddit most sharply: about four in ten adults with a college degree use it, against 28% with some college and 15% with a high school diploma or less.
If you sell to a specific group, those splits are worth more than any total. A platform used by a third of the country can still be the one nearly all of your buyers are on.
What Each Platform Is For
A share tells you who is reachable. It does not tell you what the platform is good at, and those are different questions.
YouTube, 84%. The widest reach measured, and the only place a long explanation is welcome. Someone deciding on a considered purchase will watch fifteen minutes; nobody reads fifteen minutes in a feed.
Its second advantage is that it doubles as a search engine, so a video answering a specific question keeps working long after it is posted.
Facebook, 71%. The strongest of the six for a local business with a defined geography, and the groups and events are the reason rather than the feed.
A hardware shop that answers questions in three local groups gets more out of Facebook than the same shop posting polished photographs nobody has a reason to follow.
Instagram, 50%. The showing platform. It works when the product is visible and it struggles when the value has to be explained.
Its age skew is the sharpest of the large platforms, which makes it the right answer for a young consumer audience and the wrong one for a business selling to retirees.
TikTok, 37%. The fastest place for an unknown business to be discovered, because distribution there depends less on how many followers you already have.
That is also its cost. Reach arrives in bursts that are hard to repeat, which makes it poor for anything needing a predictable schedule.
WhatsApp, 32%. Not a posting platform for most businesses but a service channel, and the one people reliably answer.
Reddit, 26%. The place where people ask for recommendations in public, which makes it valuable to read and risky to post in. Communities there are hostile to marketing that does not disclose itself.
Snapchat, 25%, and X, 21%. Both sit below Reddit, and both are smaller than their share of the conversation about them suggests. Neither is where a business goes to be found unless it already knows its buyers are there.
A note on paying creators. Paying somebody with an audience to post about you is influencer marketing, which is a different arrangement with its own pricing and its own disclosure duties.
LinkedIn and Pinterest
LinkedIn was last measured at 32% of US adults and Pinterest at 36%. Pew did not ask about either in the 2025 round, so both figures come from the one it ran between February and June 2024.
Treat those two as a year older than the rest of the table, not as unmeasured.
LinkedIn is still the obvious default for selling to other businesses, and 32% is the number to plan around until Pew asks again.
Pinterest is the one platform where saving something for later is the normal behavior, which makes it useful for anything people plan before they buy.
Where a number is older than you would like, do your own market research and ask your buyers. That will tell you more than any national figure, and it takes an afternoon.
Use this chart — embed code and citation
<a href="https://neerajjivnani.com/blog/social-media-marketing/"><img src="https://neerajjivnani.com/infographics/social-media-marketing/measured-reach.png" alt="A table of six social platforms with the share of US adults who use each, from a Pew Research Center survey of 5,022 US adults conducted 5 February to 18 June 2025. YouTube 84%, used by a majority in every age group. Facebook 71%, also used by a majority in every age group and peaking at 80% among 30 to 49 year olds. Instagram 50%, the only other platform above half, used by eight in ten adults aged 18 to 29 against 19% of those 65 and over. TikTok 37%, up from 21% in 2021. WhatsApp 32%, up from 23% in 2021. Reddit 26%, up from 18% four years earlier and used by about four in ten college graduates. Three cards note that LinkedIn and Pinterest were not in the 2025 survey and were last measured by Pew in 2024 at 32% and 36%, that the report's topline gives Snapchat 25% and X 21%, and that a business facing a gap should ask its own customers." width="1200"></a>
<p>Chart: <a href="https://neerajjivnani.com/blog/social-media-marketing/">Neeraj Jivnani</a></p>Neeraj Jivnani, "What Social Media Marketing Is, and How to Tell Which Platform Your Buyers Are On", neerajjivnani.com, https://neerajjivnani.com/blog/social-media-marketing/Free to republish with a link back to this page.
Use this chart — embed code and citation
<a href="https://neerajjivnani.com/blog/social-media-marketing/"><img src="https://neerajjivnani.com/infographics/social-media-marketing/platform-fit.png" alt="A four-column table headed "Reach tells you who you could meet. It does not tell you which platform to pick." For each of six platforms it gives the measured share of US adults, what the platform is for, and who should pick it. YouTube, 84%, is for a long explanation and doubles as a search engine, so a video keeps working long after it is posted; pick it if your buyers need convincing before they buy and somebody will film. Facebook, 71%, is for a local business through its groups and events rather than its feed; pick it if you serve one town. Instagram, 50%, is for showing a product that is visible and struggles when the value has to be explained; pick it if your buyers are young and the thing you sell shows well. TikTok, 37%, is for being discovered when nobody follows you yet, with reach arriving in bursts that are hard to repeat; pick it if you are unknown, can post often and do not need a predictable schedule. WhatsApp, 32%, is for answering rather than publishing; pick it if your customers already message you. Reddit, 26%, is for reading what people ask for in public, and its communities are hostile to marketing that does not disclose itself; pick it if you will say who you are every time. Three cards below note that YouTube and Facebook are the only platforms a majority of every age group uses, that LinkedIn and Pinterest were not in this survey and were measured by Pew in 2024 at 32% and 36%, and that one account posted to every week for a year beats four opened in a month." width="1200"></a>
<p>Chart: <a href="https://neerajjivnani.com/blog/social-media-marketing/">Neeraj Jivnani</a></p>Neeraj Jivnani, "What Social Media Marketing Is, and How to Tell Which Platform Your Buyers Are On", neerajjivnani.com, https://neerajjivnani.com/blog/social-media-marketing/Free to republish with a link back to this page.
Three Questions That Pick the Platform
Three questions narrow the list to one, and they run in this order because each answer removes options the next would otherwise have to weigh.
Who buys from you, by age? That single answer removes most of the list. If your buyers are 65 or older you are choosing between YouTube and Facebook, because they are the only two a majority of that group uses.
What can you realistically make? A platform that rewards video is the wrong choice if nobody will film anything. This is the constraint people ignore and then blame the platform for.
Where can you sustain a weekly habit? Opening several accounts at once normally ends with all but one going quiet, and people do check the quiet ones.
Add a second platform only when the first is running without effort, which usually takes longer than anyone plans for.
What to Post
Post the things your buyers would find useful or interesting if you were not selling anything, and let a minority of it sell.
The formats divide into four, and they are not equally cheap.
- Short video. Currently favored by most major platforms' ranking systems, and the cheapest to make badly.
- Images and carousels. The workhorse on Instagram, and the format a one-person business can sustain without a camera crew.
- Text posts. Cheapest of all, and the only format where the idea has nowhere to hide.
- Live and ephemeral. Stories and live video, which trade permanence for immediacy and reach.
The mistake worth avoiding is making the format the decision. The subject decides the format: a thing you have to show becomes video, a thing you have to explain becomes text.
Say a kitchen fitter has two things to publish this week. The before-and-after is video, and how to choose a worktop is text, and neither choice was about what the ranking system prefers.
One practical rule. Where the two pull against each other, the format you can produce every week without dreading it beats the format the ranking system currently rewards.
What Each Platform Currently Favors
Formats are not equally welcome everywhere, and posting the wrong one is the most common reason a good post disappears.
Video is favored almost everywhere, and short vertical video most of all. That is a ranking decision by the platforms rather than a statement about what people prefer.
Instagram and TikTok will show video to people who do not follow you. That is the mechanism behind sudden reach, and it is why both are the fastest places to be discovered.
Facebook rewards things that start conversations, which in practice means questions, local news and events more than polished promotion.
YouTube is the one place where length helps you, because people arrive there intending to watch.
Reddit rewards text and punishes anything that reads like an advertisement, including a link posted without context.
The Ratio That Decides Whether a Feed Gets Read
The useful split is not between formats but between posts that ask for something and posts that do not. A feed that only asks stops being read. A feed that never asks produces goodwill and no customers.
No study fixes that ratio. The rules people quote for it are conventions, and they are worth knowing for what they are.
Watch where the replies stop, and you will have your own inside a month.
The Posting Rules People Ask About
Two posting rules come up constantly, and both deserve a straight answer.
The 50/30/20 rule says roughly half your posts should be your own content, about a third curated from elsewhere, and the remainder promotional.
The 5-5-5 rule is a community-management routine: engage with five accounts, reply to five comments, and share five pieces of other people's material.
Neither is a finding. Both are conventions circulated among practitioners, and no primary source defines either or measures whether it works.
That does not make them useless. A ratio you follow stops an account becoming a sales feed, and the routine forces engagement that otherwise gets skipped.
So use them as a starting habit and not as a rule with evidence behind it. If following one keeps you posting when you would otherwise have gone quiet, it has already earned its place.
Community, and What Engagement Is For
Engagement is a means, not an end. It matters because the ranking systems read it, and because answering somebody in public is visible to everybody else reading. That second reason is the stronger of the two, and it is the best argument there is for putting time into this channel at all.
Customer service on social is marketing. Say a customer asks whether you deliver on Sundays. Your answer is read by everyone else wondering the same thing, and it costs you one line.
The reverse is also true and is why this work cannot be half-done. A visible unanswered complaint is read the same way, by the same people.
Set a rule you can keep: a window in which you reply, and a decision about which things you answer in public versus take to a message.
What engagement does not tell you is whether anything sold. A post can be widely liked by people who will never buy, and the two numbers need separating.
A Routine You Can Keep
Community work fails through inconsistency, not effort, so the routine matters more than the volume. Twenty minutes a day, at a fixed time, handles the replies for most small accounts. An hour once a week does not, because the questions arrive daily.
Answer questions in public and take complaints private, after replying once in public so that everybody reading can see you responded.
Reply to the quiet ones. A first-time commenter who gets an answer has a reason to come back. An existing follower already had one.
Building a Strategy
A social media strategy is seven decisions written down before anything is posted. Written down is the part that matters, because an unwritten strategy is a preference.
- The goal, as one number. Being known, being asked, or being bought from. Pick one.
- The audience, described by who they are rather than by what you wish they were.
- The platform, chosen on the measured audience data and never on habit.
- The formats you can genuinely sustain.
- The frequency, set at a level you can hold for a year.
- The voice, decided once so that three people can post without sounding like three people.
- The number you check, and how often you are allowed to check it.
Most plans fail on the fifth and sixth. A frequency set optimistically is abandoned in six weeks, and an undecided voice produces an account that reads as a committee.
What Each Decision Costs to Get Wrong
The seven are not equally expensive, and knowing which ones are cheap to change is what makes the list usable.
The goal and the audience are expensive. Get either wrong and everything downstream is work aimed at the wrong people, and you will not find out for months.
The platform is moderately expensive. Changing it costs you the audience you built, though the material usually transfers.
Format, frequency and voice are cheap. All three are adjustable in a week once you see what happens, and none is worth agonising over before you start.
The number you check is free to change and rarely changed, which is the trap. A number chosen because it was easy to find will quietly become the goal.
The Part Most Strategies Skip
Write down what you will stop doing. A strategy that only adds is a list of intentions.
For a business with one person doing the posting, the honest version is that one platform gets the effort and the others get an up-to-date profile and nothing else.
An abandoned account that still lists a phone number is fine. An abandoned account posting three-year-old offers is not.
What Paid Advertising Buys
Paid advertising buys delivery to a defined audience on a schedule you control. That is the whole product, and it is genuinely valuable. It buys three things a post cannot: a predictable number of impressions, targeting by attributes you specify, and a result this week rather than this quarter.
What it does not buy is a reason to care. An ad that reaches exactly the right person with a weak message fails precisely on schedule.
Plan a first budget around a low conversion rate rather than a hopeful one. A social feed converts worse than a search result, and the arithmetic has to survive that.
The Mistake That Wastes the Most Money
Boosting a post because it did well organically is the most common way to waste a first budget.
That post reached an audience which already follows you. Paying to show the same thing to strangers is a different test, and the result usually disappoints.
The better use of a first budget is to define an audience deliberately, show them something made for them, and measure whether they did the thing you wanted.
How the Targeting Works
Audience targeting works much the same way everywhere: every platform offers roughly the same three ways to define who sees an ad, and they differ in cost and reliability.
By attribute. Age, location, interests, behavior. The broadest and the least reliable, because interest data has degraded as privacy controls tightened.
By your own list. Upload the email addresses of your customers and advertise to them, or to people the platform judges similar. This is the strongest targeting available to a small business and the most underused.
By what people did on your site. Show something to people who visited a page and did not buy. The highest-converting audience and the smallest.
Separately from those three, most of the big ad platforms sell a lead form that collects a name and an address inside the feed instead of sending somebody to your site.
Start with your own list. It describes people you already know rather than people the platform has guessed at.
What to Watch, and What to Ignore
Watch the numbers that would change a decision, such as whether anybody clicked through to you, and ignore the rest as scenery.
- Reach or impressions. Whether anybody saw it. Useful as a trend, meaningless as a target.
- Engagement rate. Whether the people who saw it reacted. This is the number the ranking systems read.
- Clicks to your site. The first point at which a business outcome is possible.
- Conversions. Whether the click did the thing you sent it for. The only one connected to money.
- Follower growth. The weakest number on the report, and the one most often presented first.
Followers are eligibility, not delivery. Having a follower means the platform may show them something. Whether it does is decided by the ranking system, which is the whole lesson of what happened to organic reach on Facebook.
The discipline that makes the difference is deciding the number before the campaign, so that success cannot be redefined once the result is in.
Give it ninety days before judging. A channel whose distribution is decided by a ranking system needs enough posts for the system to have an opinion about you.
What Ninety Days Should Produce
At the end of a first quarter you should be able to answer three questions, and follower count is not one of them.
Which posts got replies? Not likes. Replies are the signal that somebody had something to say, and they are the cheapest guide to what to make more of.
Did anyone arrive on your site from this? One number, from your own analytics rather than the platform's dashboard.
Did anyone ask about buying? In a message, a comment, or in person saying they saw it. This is the answer that decides whether the channel continues.
If all three are empty after ninety days of consistent posting, the problem is usually the offer or the audience rather than the posting.
Managing It: Tools, Team and Time
Managing social media is mostly scheduling, replying and measuring, and none of it needs paid tooling to start.
The three jobs are worth separating, because they need different people and different hours.
- Making the material is a writing and production job.
- Publishing and replying is a routine that needs consistency more than talent.
- Measuring and deciding is an analytical job, and it happens monthly, not daily.
In a small business one person does all three, and the failure mode is that the third job never happens because the first two are never finished.
The honest time cost for one platform, posted a few times a week with replies handled, is a few hours weekly.
If a plan puts it lower, check whether it counted the replying or only the publishing. The replying is the half that gets left out, and it is the half that earns the credibility.
One Platform, One Goal, One Number
Beginners should start with one platform, one goal and one number, and should resist opening more accounts than that.
- Open one account and leave the rest closed. Which one comes from who buys from you.
- Write down the one thing you want, as a number you could check in ninety days.
- Fill the profile out properly. What you sell, where you are, and how to reach you. This is the cheapest thing on the list and the most commonly half-done.
- Decide a frequency you can hold for a year. Pick the number you will still be posting in month eleven, not the number that sounds serious now.
- Do not judge a post in its first week. The ranking system needs material before it can have an opinion about you, so give the account thirty days and the channel ninety.
- Reply to everything in the first months, inside whatever daily window you can hold. Early accounts grow through conversations, not reach.
- Read the numbers once a month and change one thing at a time.
All of it rests on being honest about who buys from you. Get that right and the platform stops being a guess.
Then be equally honest about what you can keep up once the novelty wears off. A habit you cannot keep was the wrong habit to start.