Conversion Rate Optimization: How to Do It, and What to Fix First
Where your rate is really being lost, how much traffic a test needs before it settles anything, and what to do when you do not have that much.

/ On this page12 sections
Conversion rate optimization is the work of getting more from the traffic you already have. Most of what it fixes is not a design problem: the rate leaks at price, at speed and at the checkout, before anybody argues about a button.
Where it leaks is findable in an afternoon with a funnel report. Whether you can prove a fix with a test is the harder question, and it comes down to how much traffic you have.
Start there, and what to fix has an answer instead of a benchmark.
Conversion Rate Optimization, in One Definition and One Formula
Conversion rate optimization (CRO) is the work of increasing the share of the people already on your site who take the action the site exists for.
It changes the page, the offer and the flow, and never the traffic.
The formula is one division. Take your conversions, divide by your visitors, multiply by 100.
A site with 10,000 sessions last month and 500 purchases converted at 5%. Nothing about that arithmetic is contested.
Everything else about it is.
Both numbers in that fraction are choices.
Macro Conversions, Micro Conversions, and Which One You Are Counting
A macro conversion is the thing the business runs on: a purchase, a signed contract, a paid subscription. A micro conversion is a step toward it, such as an add to cart, a newsletter signup or a saved item.
Which ones matter depends on what the business is. Media sites count pageviews, ad views and newsletter subscriptions.
Ecommerce counts product sales, add to carts and cart completion. Business-to-business sites count leads generated and deals closed.
Counting the micro conversion flatters the number, sometimes by a wide margin.
That is fine as a diagnostic and dishonest as a headline, and the two get mixed constantly.
Pick one macro conversion as the number the site is judged on. Keep the micro ones as instruments that tell you where people stop.
Sessions or People, and How Long You Wait
The rule for your own site is simple.
Count sessions when the same customer can come back and buy again next month. Count people when the conversion happens once, as it does when somebody subscribes.
The gap between those two is large. One person visiting four times before buying is one conversion in four sessions, or one conversion in one person.
There is a third decision underneath, and it is the window.
The familiar 2 to 4% figure is a 30-day rate: the share of users who come to the site and convert within 30 days. That is how Miikkulainen and colleagues define it, in a 2017 conference paper.
A within-session rate and a within-30-days rate are different measurements of the same site. When a benchmark quotes neither, you cannot tell which one you are being compared against.
Is Your Conversion Rate Good?
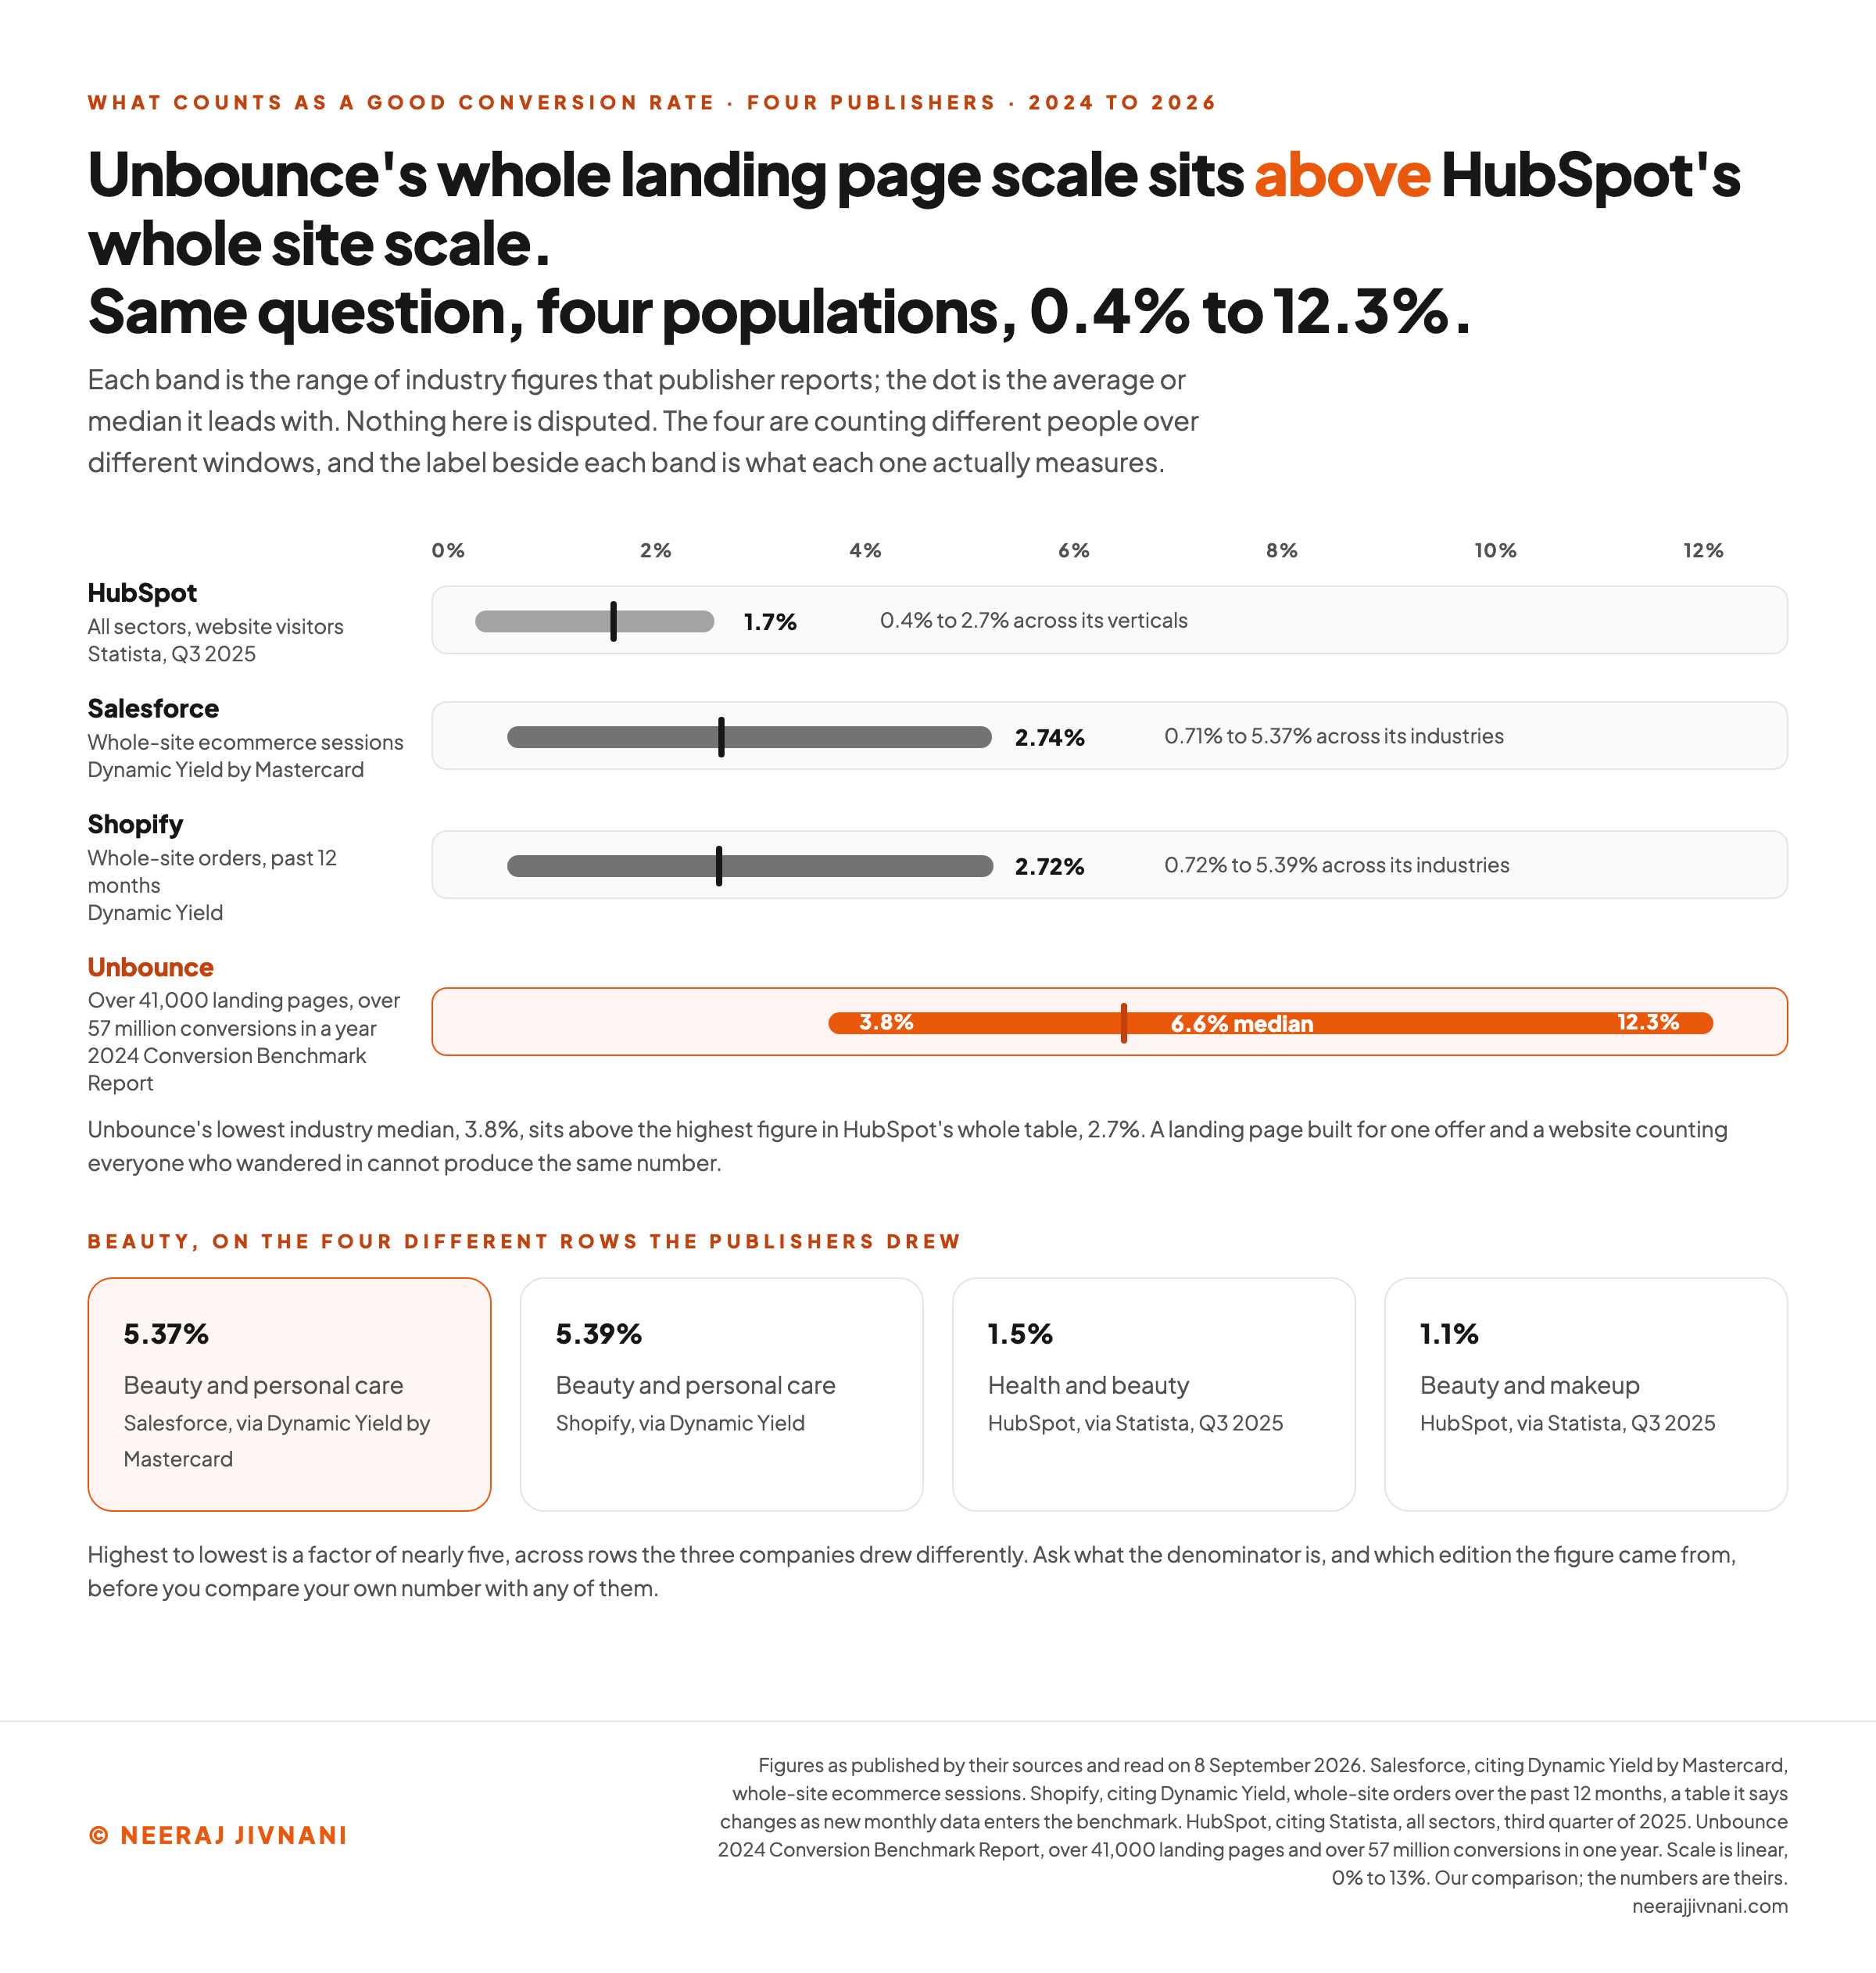
There is no single good conversion rate, and the reason is not the usual one about industries varying. The four most widely published benchmarks measure different populations, over different windows, and nobody reconciles them.
Here is what each one counts, with the figure it leads with.
| Who publishes it | Headline figure | What it is counting | Credited to |
|---|---|---|---|
| Salesforce | 2.74% global average | Whole-site ecommerce sessions | Dynamic Yield by Mastercard |
| Shopify | 2.72% global, 2.66% Americas | Whole-site ecommerce orders, past 12 months | Dynamic Yield |
| HubSpot | 1.7% across all sectors | Website visitors, third quarter of 2025 | Statista |
| Unbounce | 6.6% median | Over 41,000 landing pages, over 57 million conversions in a year, 2024 edition | Its own platform data |
Inside one category the gap is a bigger multiple than the gap between the headline numbers.
Salesforce puts beauty and personal care at 5.37% and Shopify puts the same category at 5.39%. HubSpot's nearest rows, health and beauty and beauty and makeup, come out at 1.5% and 1.1%.
The top of that is nearly five times the bottom, and part of the gap is that the three companies drew the category differently.
All four figures are published in good faith and none of them is measuring the same thing.
The whole scales sit apart too. HubSpot's verticals run from 2.7% for skincare down to 0.4% for luxury apparel, and Unbounce's lowest industry median is 3.8%, so the two do not overlap anywhere.
Two of the questions people ask most about this have real answers once the denominator is named.
Is a 12% conversion rate good? On a whole website it would be extraordinary, at four to seven times the site-wide averages above. On a single landing page for a single offer it is strong but ordinary, sitting a little under the 12.3% top of Unbounce's nine industry medians.
Is a 20% conversion rate good? It is above every figure published on either scale, which almost always means the denominator is narrow. One page, one campaign, or one already-qualified segment will produce it long before a site five times better than its industry does.
Why One Source Gives Two Different Answers
Salesforce and Shopify both credit their industry tables to Dynamic Yield, and no row in the two tables carries the same number.
| Industry | Salesforce, via Dynamic Yield by Mastercard | Shopify, via Dynamic Yield |
|---|---|---|
| Beauty and personal care | 5.37% | 5.39% |
| Food and beverage | 5.03% | 4.8% |
| Pet care and veterinary services | 4.4% | 4.71% |
| Multi-brand retail | 3.15% | 3.01% |
| Fashion, accessories and apparel | 2.81% | 2.77% |
| Consumer goods | 2.43% | 2.47% |
| Home and furniture | 1.2% | 1.22% |
| Luxury and jewelry | 0.71% | 0.72% |
| The average quoted alongside | 2.74%, global | 2.72% global, 2.66% Americas |
Every row differs, and the differences do not run one way. Shopify is above Salesforce on pet care and consumer goods and below it on food and beverage and multi-brand retail.
That is what two extracts of the same live dataset look like. Shopify says so on the page, in as many words: its figures "change as new monthly data enters the benchmark".
So neither table carries the date its extract was taken, and one of them will have moved by the time you read this. Treat any published benchmark as a snapshot, and go and find its date and its geography before you lean on it.
A Landing Page Is Not a Website
Unbounce's 2024 Conversion Benchmark Report is built from over 41,000 landing pages and over 57 million conversions in a single year, and it reports a median of 6.6% with nine industry medians running from 3.8% to 12.3%.
A landing page is built for one offer and reached mostly by people who clicked an advertisement for that offer. A website's session count includes everyone who wandered in.
Those two populations cannot produce the same number. That single distinction accounts for most of the gap in the table above.
Second-hand figures carry a related trap. A benchmark can be quoted perfectly accurately and still be out of date, because the report behind it gets reissued and the numbers move.
Ask which edition a number came from, and what it counted, before you measure yourself against it.
The Only Comparison That Survives Scrutiny Is Your Own Last Quarter
Your own site, last quarter, on the same definition, is the one comparison where the population, the window and the counting rule are all held constant. Everything else moves at least one of them.
Published benchmarks still earn their place as a sanity check on the order of magnitude. A whole-site rate far under the 1.7% HubSpot reports across all sectors points at something broken rather than something improvable.
Put your own numbers in below and watch a single site produce three defensible rates, each with a different benchmark attached to it.
One month, three defensible conversion rates
Put in a single month of your own trading. Each row divides a conversion count by the visitor count drawn from the same population, then reads the result against the published band measured on that population, which is named beside it.
That is below the published band of 2.66% to 2.74%.
Whole-site ecommerce sessions, the right denominator where a customer can buy more than once. Band published by Salesforce (2.74% global) and Shopify (2.72% global, 2.66% Americas), both crediting Dynamic Yield.
That is above the published band of 1.7%.
Website visitors across all sectors, which is the population HubSpot's figure is drawn from. Band published by HubSpot, citing Statista, third quarter of 2025.
That is inside the published band of 3.8% to 12.3%, median 6.6%.
Landing pages built for one offer, which is a different population from a website, so this row uses the conversions earned ON those pages. Band published by Unbounce, 2024 Conversion Benchmark Report.
One month of trading, three honestly matched denominators, and your own highest number is 3.0 times your lowest. Every one of the three is true. Which one you quote decides which published band you should be compared against, and nobody can tell you whether your rate is good until you have said so.
Use this chart — embed code and citation
<a href="https://neerajjivnani.com/blog/conversion-rate-optimization/"><img src="https://neerajjivnani.com/infographics/conversion-rate-optimization/benchmark-spread.png" alt="Four publishers' conversion rate ranges drawn as bands on one linear axis from 0% to 13%, with a marker on each for the figure it leads with: HubSpot 0.4% to 2.7% marked at 1.7%, Salesforce 0.71% to 5.37% marked at 2.74%, Shopify 0.72% to 5.39% marked at 2.72%, and Unbounce 3.8% to 12.3% marked at its 6.6% median in orange, so Unbounce's lowest band sits entirely above HubSpot's highest. Underneath, four cards give beauty as 5.37% from Salesforce, 5.39% from Shopify, and 1.5% and 1.1% from HubSpot." width="1200"></a>
<p>Chart: <a href="https://neerajjivnani.com/blog/conversion-rate-optimization/">Neeraj Jivnani</a></p>Neeraj Jivnani, "Conversion Rate Optimization: How to Do It, and What to Fix First", neerajjivnani.com, https://neerajjivnani.com/blog/conversion-rate-optimization/Free to republish with a link back to this page.
What One Point of Conversion Rate Is Actually Worth
One point of conversion rate is worth whatever your traffic multiplied by your order value says it is, and the arithmetic is why the work gets funded.
A landing page converting at 10% with 2,000 visitors a month produces 200 conversions. Take it to 15% and the same traffic produces 300, a jump of 50%.
The same sum works on leads. At 1%, 10,000 visitors give you 100; at 2%, they give you 200, with nothing more spent on traffic.
A conversion rate can also rise because you narrowed the traffic to people who were going to buy anyway.
So weigh the rate alongside customer quality, acquisition cost and revenue impact. A rate that climbs while total revenue falls is a measurement problem wearing a win.
Most sites never get far enough to have that problem. Shopify's November 2025 Merchant Survey found that less than half of its merchants track conversion rate at all, and that even among merchants earning more than $1 million, only 43% monitor it.
Why the Traffic You Already Have Is Worth More Than It Was
The price of a visit has gone up, which changes the arithmetic above in favor of the people already on the site.
AI Overviews now answer part of the query on the results page, so the same position in search delivers fewer visits than it did, on HubSpot's 2026 reading. The work of earning a visitor got harder while the value of wasting one stayed the same.
Traffic from large language models is already 4.4 times more valuable in conversions than regular organic traffic, on Semrush's own data.
So the organic arrivals are fewer, and a growing share of what does arrive comes from somewhere that converts better. Either way, the page they land on is worth more than it was.
Where the Rate Is Actually Lost
Conversion is lost in a small number of predictable places. Most of them are commercial decisions before they are design ones.
Over 70% of shoppers abandon their cart at checkout, on Salesforce's figures. The four reasons it names are slow delivery estimates, high extra costs, a complicated checkout, and a site that does not feel trustworthy.
Two of those four are decisions somebody made about price and logistics, not about the interface.
Speed is the other reliable leak.
About half of shoppers leave mobile pages that take longer than two seconds to load. Salesforce's figure is 53%.
A page that has not appeared cannot persuade anybody, and nothing else you changed on it was ever seen.
Shipping is the third. 75% of consumers prioritize free shipping over faster delivery, on Salesforce's figures, so where you set a free-shipping threshold moves the rate.
The Handful of Pages That Carry the Number
Start where the traffic and the value already are: your highest-traffic pages first, then the highest-value pages that convert below the rest of the site.
Say a clothing retailer whose page for hats draws heavy traffic and converts far below everything else. Fixing that one page moves the business more than fixing several quiet ones.
In practice the number is carried by a short list of pages.
- The pages people land on from advertisements and search. These have the tightest promise to keep, because the visitor arrived expecting one specific thing.
- Product, pricing and category pages. Where the decision gets made, and where a missing detail does the most damage.
- Forms. A form is a list of reasons to leave. Take out every field you will not act on, break what is left across steps, and say in one line why you are asking for the ones you keep.
- Checkout. Where over 70% of shoppers abandon, and the page people redesign last.
- Blog and guide pages. Salesforce reports that well-placed calls to action convert at 10% or higher, and that adding call to action buttons inside blog posts can increase conversions by over 120%.
Behavior Shows You Where, Never Why
A funnel report, a session replay and a heatmap all answer the same question: where people leave. None of them touches the second question, which is what made them go.
The second question needs a person. Ask on the order confirmation page, while the visit is still fresh, what nearly stopped them and what they came looking for and did not find.
The sharper version of that is that a spreadsheet cannot tell you what somebody was trying to do. Enough columns will describe the behavior precisely and still not explain any of it.
That has a limit worth naming. People are unreliable about why they did something, so what a survey buys you is a hypothesis to test rather than an answer to act on.
The Six Steps, and the Two Everyone Skips
The process is six steps long and none of them is complicated.
Two get quietly dropped anyway, and they are the first and the fifth.
- Name the conversion and the denominator. One macro conversion, one visitor definition, one window. Write them down, because you will be comparing against this number for a year.
- Find where the number is lost. Build a funnel report from your analytics and read the drop between each step, rather than the total.
- Ask people why. On-site surveys, exit surveys and post-purchase questions on the pages the funnel report accused.
- Write a hypothesis that could be proved wrong. Not "improve the checkout" but a specific change with a predicted effect on one named metric.
- Run the test, if you have the traffic for it. If you do not, apply the change and measure the before and after honestly, knowing it is weaker evidence.
- Decide, then go round again. Adopt, revert or refine, and take the next drop on the funnel report.
Step 1 gets skipped because it feels like paperwork, and the cost of skipping it is a year of numbers that cannot be compared with each other.
Step 5 gets skipped in the other direction, by running a test on traffic that could never resolve it.
Duration is the part people ask about first, and it is the least useful answer. The usual advice is two weeks for a small change and four to 12 weeks for an A/B test.
What decides whether a test settles anything is the sample size, the significance threshold and the traffic floor underneath it. Without those, a test can run its two weeks and prove nothing.
What a Testable Hypothesis Has in It
A hypothesis worth testing has four parts: the problem you observed, the change you are making, the effect you predict on one named metric, and the result that would tell you that you were wrong.
Here is one that has all four. Semrush's team saw that a popup led with features, redesigned it around benefits on the reasoning that users care about results, and measured a 14% lift in conversions.
The fourth part is the one people leave out. A hypothesis with no falsifying result is a plan, and a plan cannot lose.
The Win Rate Is Not One Number
The win rate for a tested idea depends mostly on how the test was built.
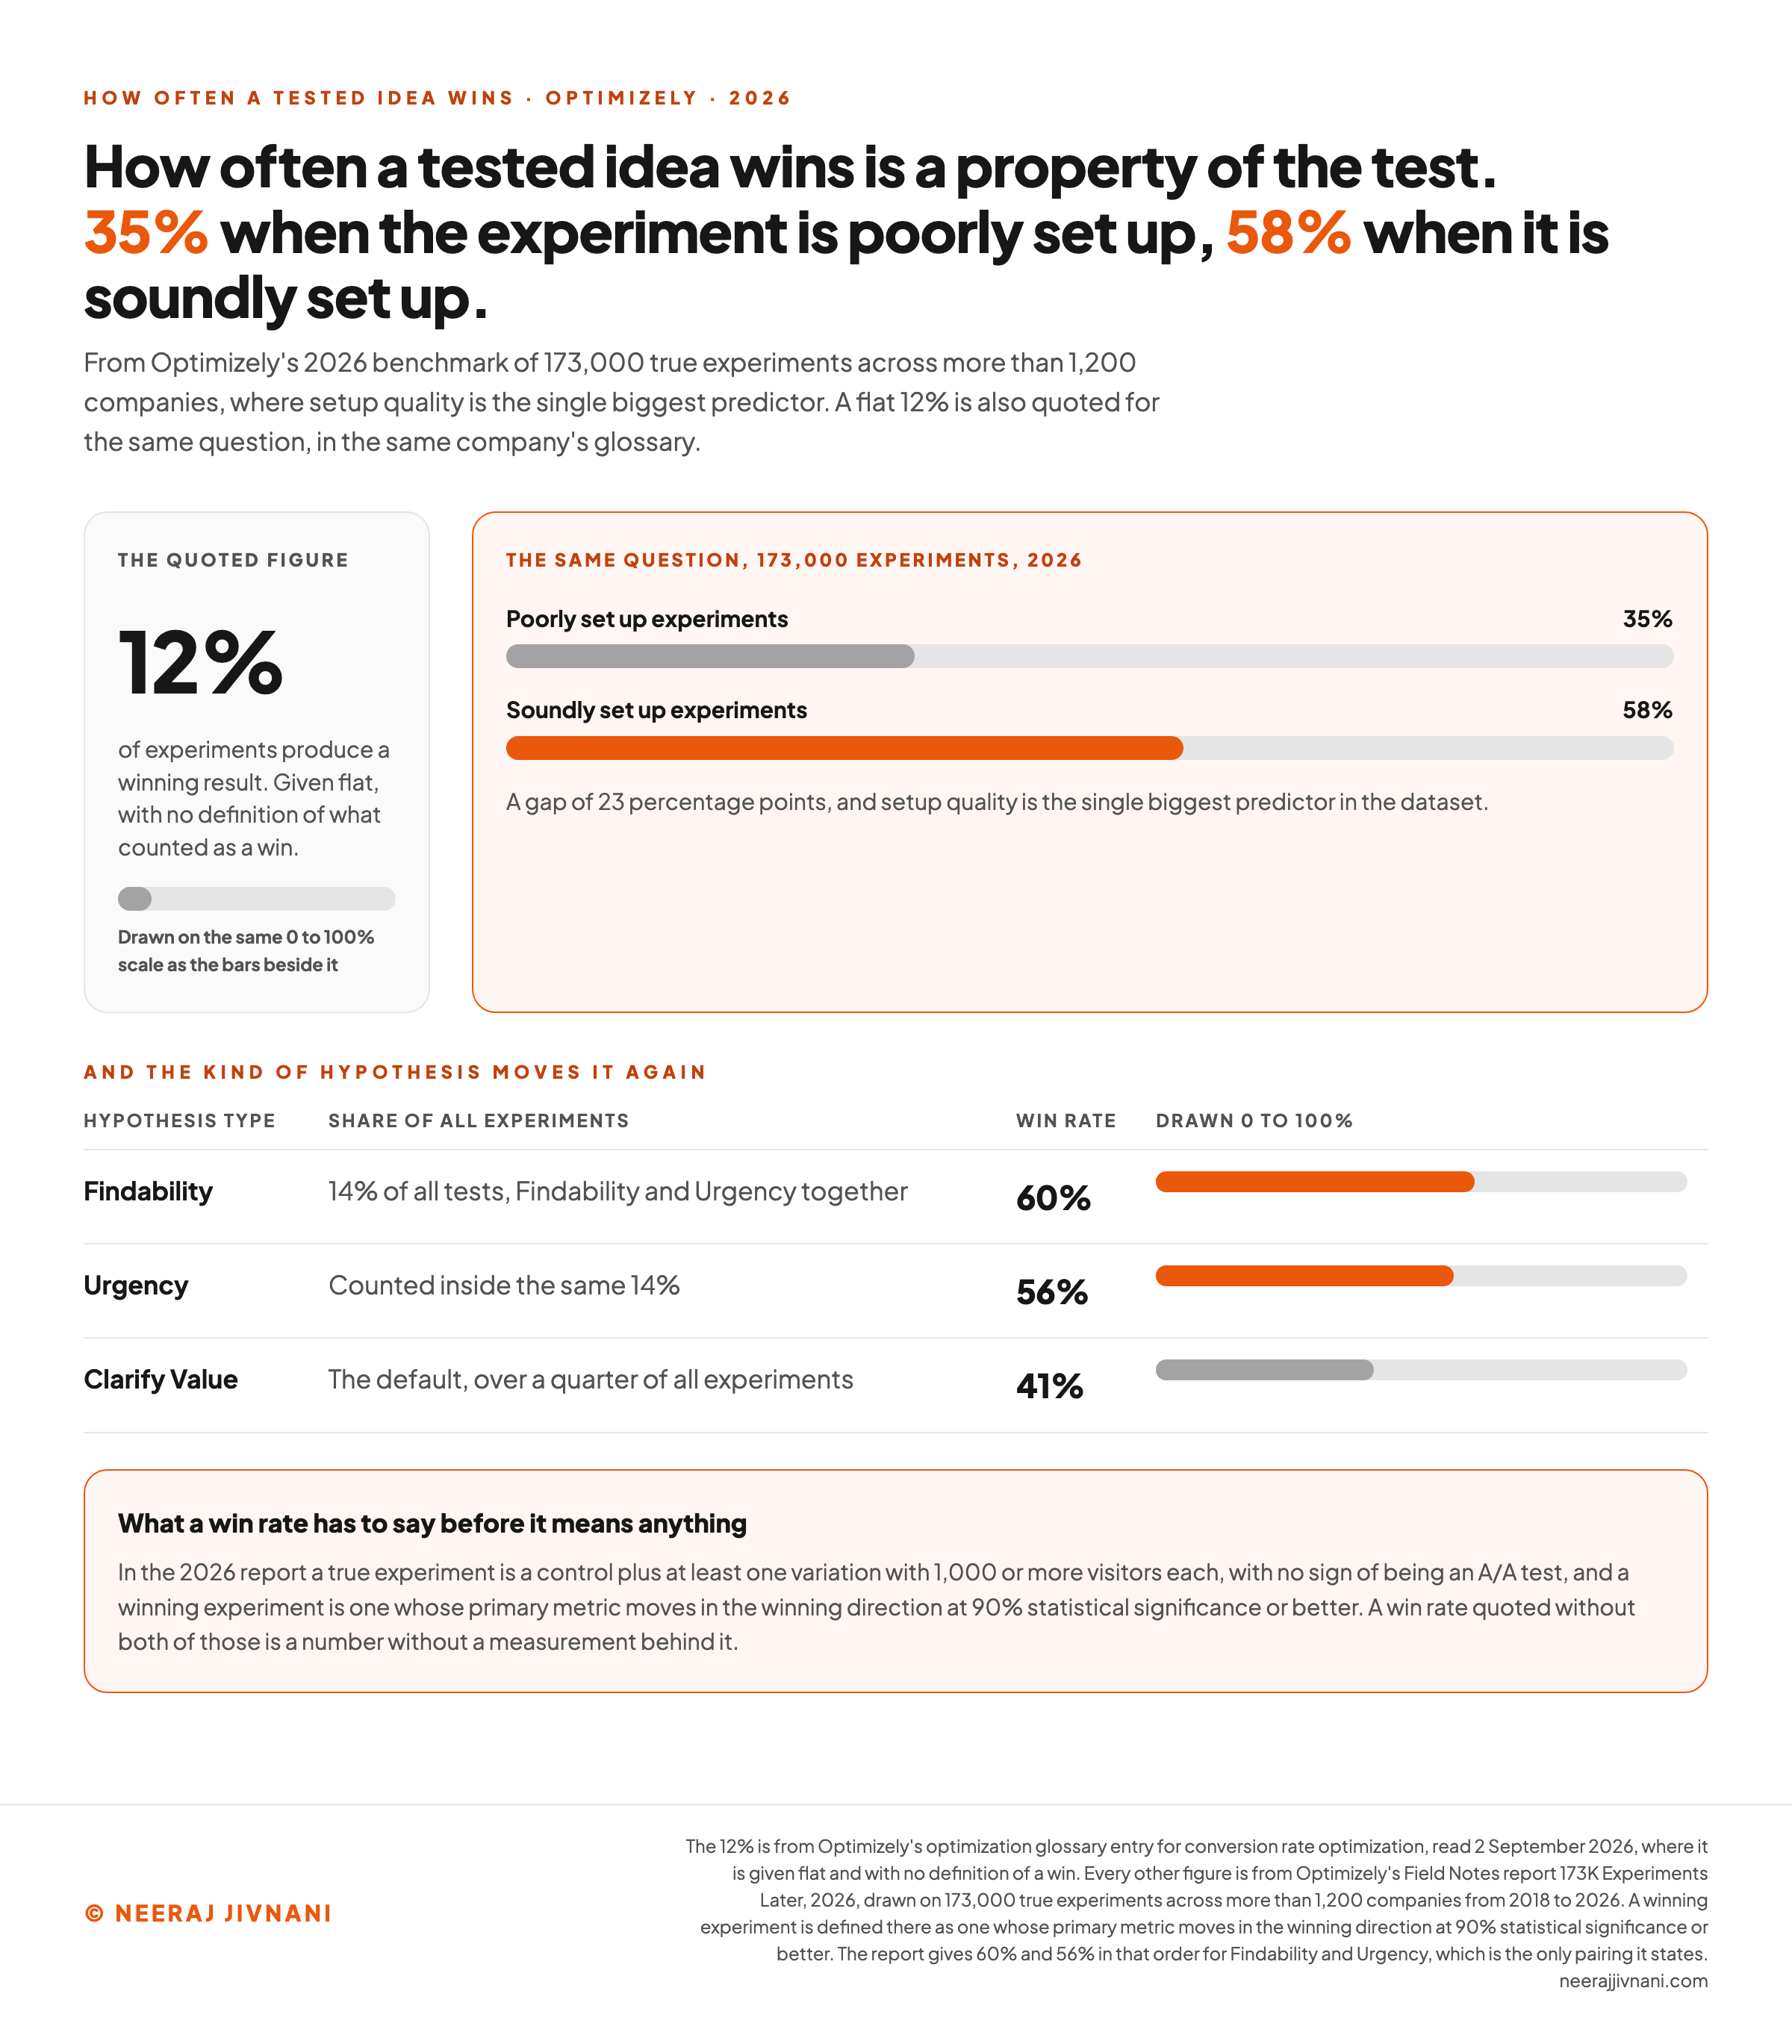
Soundly set up experiments win 58% of the time and poorly set up ones win 35%, a gap of 23 percentage points. Those come from Optimizely's benchmark of 173,000 true experiments across more than 1,200 companies from 2018 to 2026, where setup quality is the single biggest predictor of all.
Two definitions are doing real work in that split, and they are worth borrowing for your own reporting.
A true experiment is a control plus at least one variation with 1,000 or more visitors each, with no sign of being an A/A test. A winning experiment moves the primary metric in the winning direction at 90% statistical significance or better.
A flat 12% is also quoted for the same question, from Optimizely's own glossary. The split above is the number to work from, because it says what it counted.
The kind of hypothesis moves it again.
Clarify Value hypotheses are the default, taken in over a quarter of all experiments. They win 41% of the time.
Findability and Urgency together account for 14% of tests, and they win 60% and 56% of the time.
The Method Decides the Win Rate, Not the Ideas
There are two opposite ways to get this wrong, and they pull against each other.
Test loosely and you crown the wrong winner.
Where only weak statistical evidence is obtained, "the winner candidate is most likely not the one with the best true conversion rate, but one that got lucky with evaluations". That is Qiu and Miikkulainen, in a 2019 paper for the Association for the Advancement of Artificial Intelligence.
Test strictly and you never see the good ideas.
Each step demands statistical significance, so only a few designs get tested. And a process aimed at reducing false positives increases false negatives: designs with good ideas get overlooked. Both are Miikkulainen and colleagues' complaints in their 2017 paper.
Both point the same way. The set-up is not a detail you get to skip on the way to the idea.
Use this chart — embed code and citation
<a href="https://neerajjivnani.com/blog/conversion-rate-optimization/"><img src="https://neerajjivnani.com/infographics/conversion-rate-optimization/win-rate-split.png" alt="Two bars on a 0 to 100% scale from Optimizely's 2026 benchmark of 173,000 experiments, showing 35% for poorly set up experiments and 58% for soundly set up ones, a gap of 23 percentage points, beside one short bar for the flat 12% win rate quoted in the same company's glossary. A table below breaks the win rate down by hypothesis type on the same scale, Findability 60%, Urgency 56% and Clarify Value 41%, and a closing panel gives the report's own definitions of a true and a winning experiment." width="1200"></a>
<p>Chart: <a href="https://neerajjivnani.com/blog/conversion-rate-optimization/">Neeraj Jivnani</a></p>Neeraj Jivnani, "Conversion Rate Optimization: How to Do It, and What to Fix First", neerajjivnani.com, https://neerajjivnani.com/blog/conversion-rate-optimization/Free to republish with a link back to this page.
What One Real Test Consumed
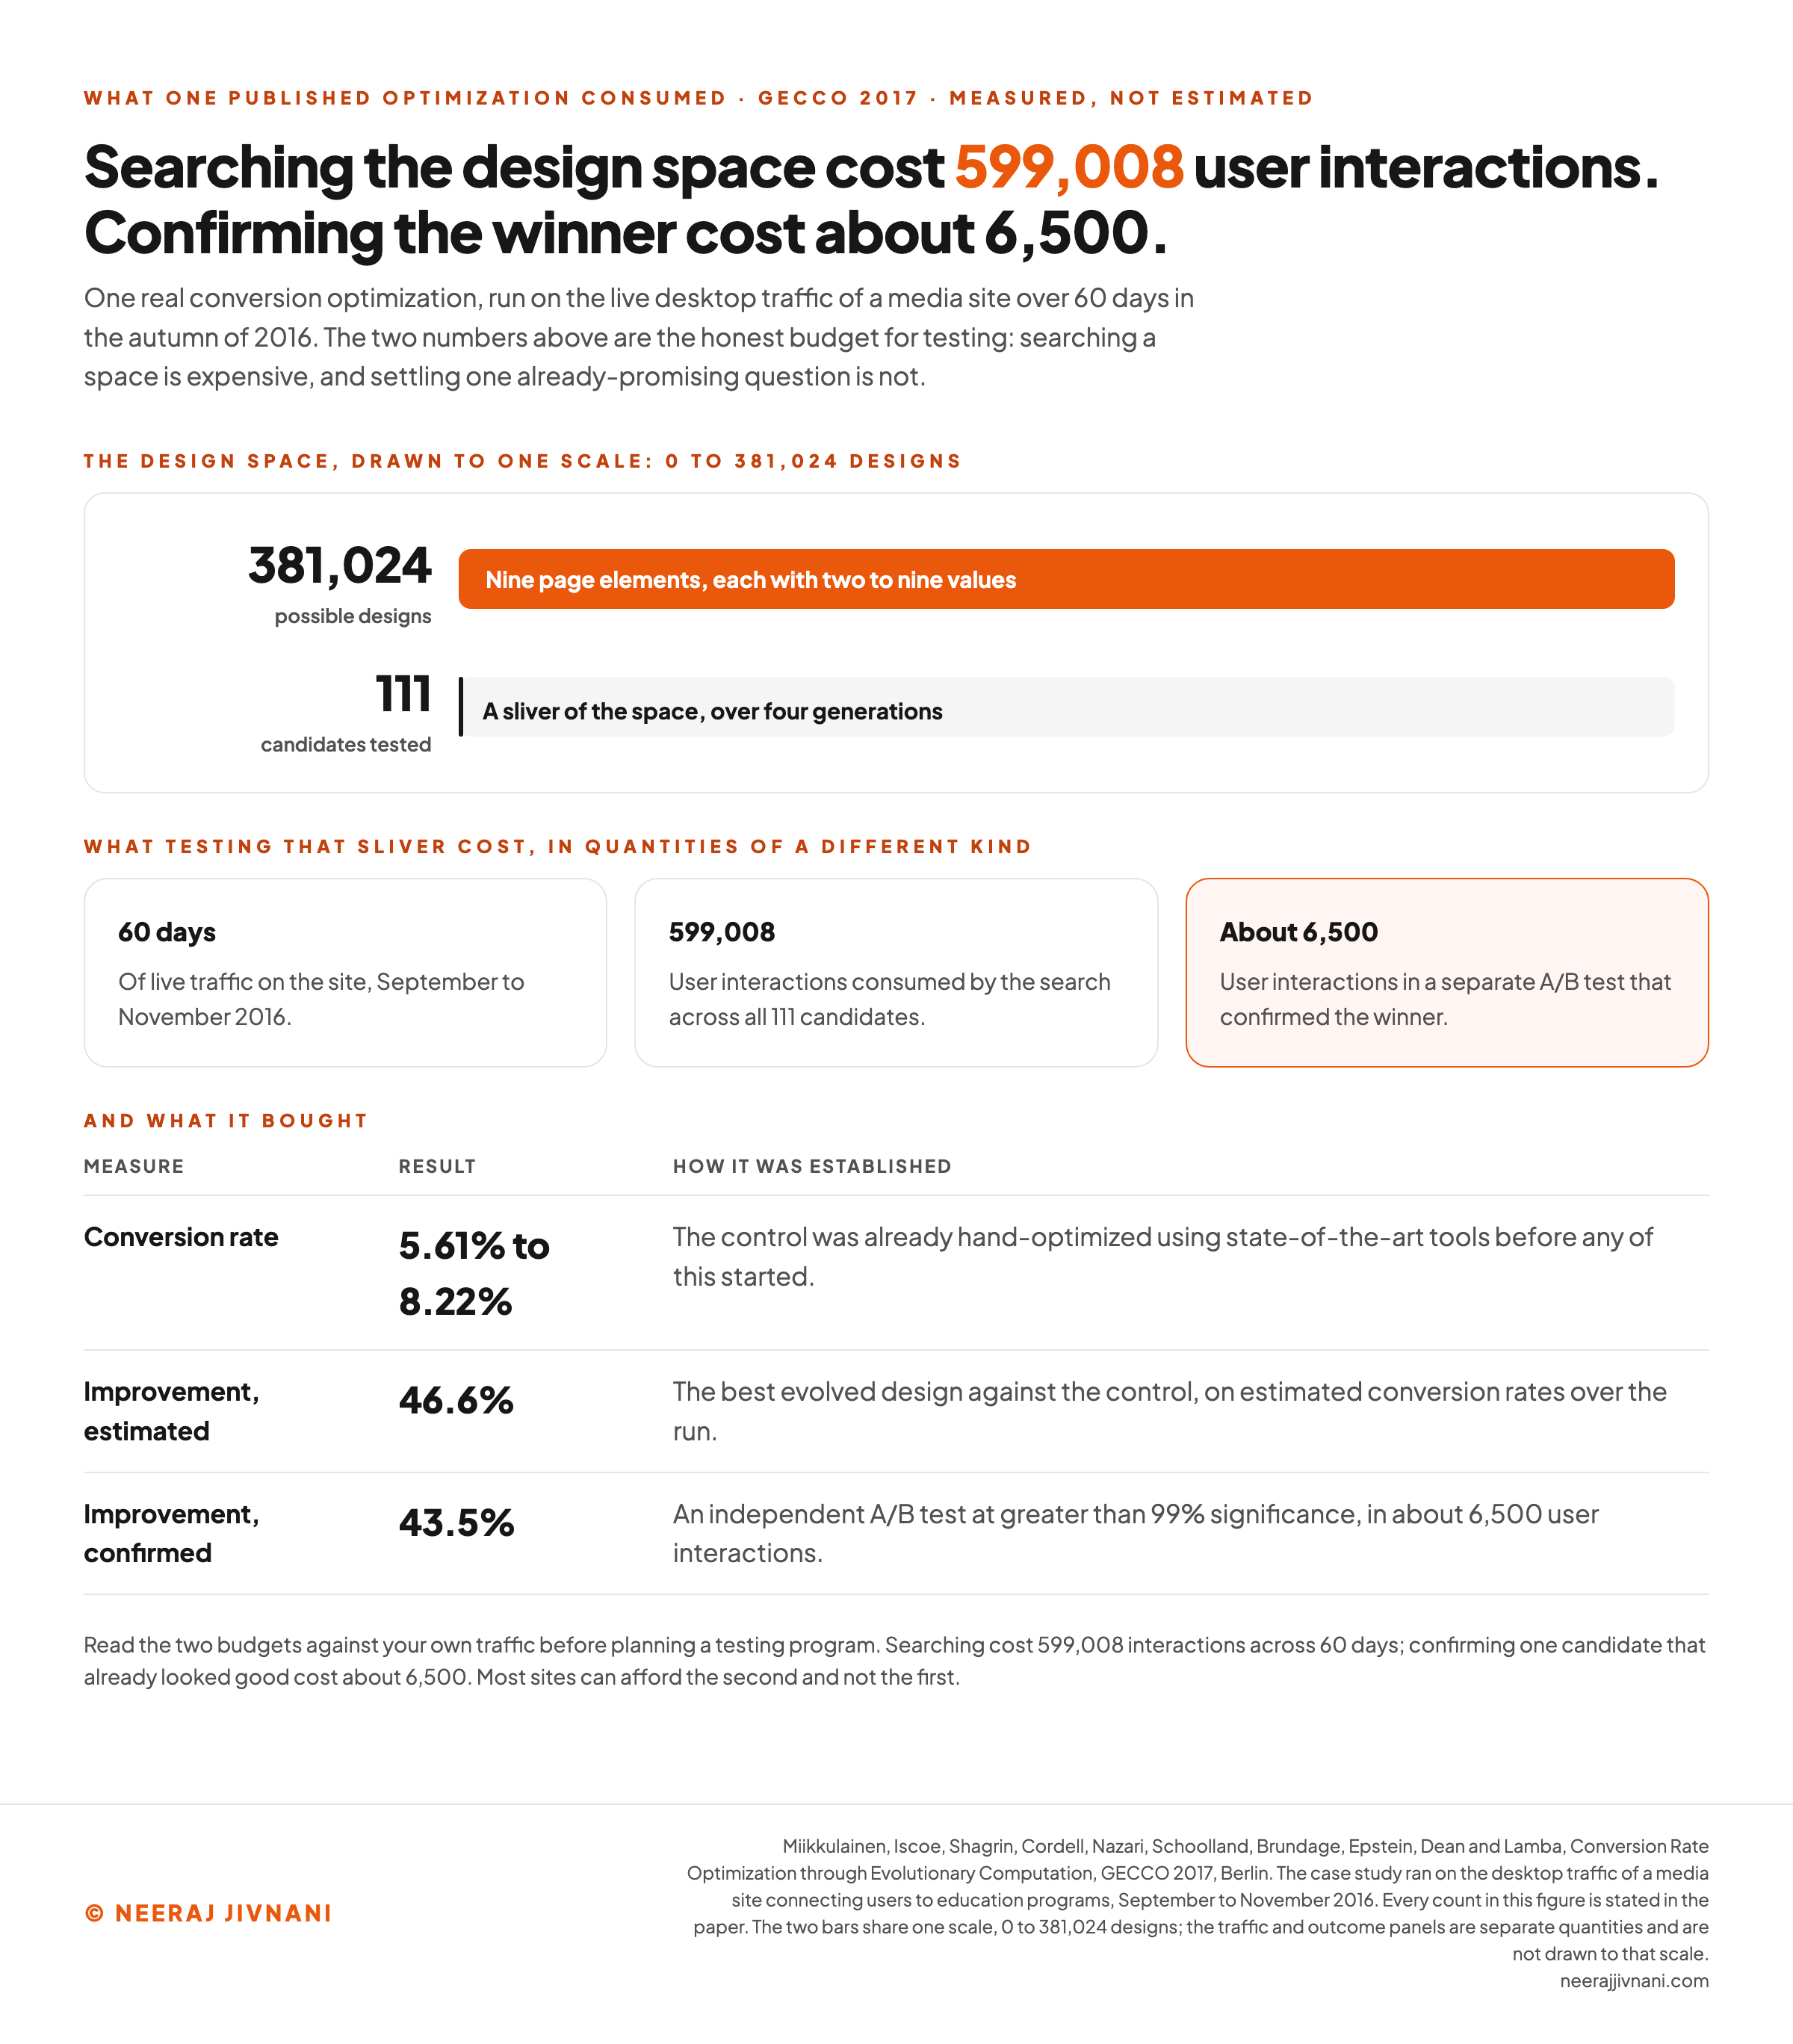
One published optimization ran through 599,008 user interactions across 60 days, which is the honest scale of a real test.
Miikkulainen and colleagues ran it on the desktop traffic of a media site connecting users to education programs, from September to November 2016.
The control page converted at 5.61%. The designers listed nine page elements with two to nine values each, which defines a space of 381,024 possible designs.
Over 60 days, in four generations, the system tested 111 of those candidates across 599,008 user interactions. The best design converted 46.6% better than the control, moving the page from 5.61% to 8.22%.
Then came the part that matters most for anyone planning a test.
An independent A/B test in Optimizely confirmed a 43.5% improvement at greater than 99% significance, and it took about 6,500 user interactions to do it.
The control it beat was not a straw man either: it had already been hand-optimized using state-of-the-art tools.
Read those two numbers as a budget. Searching a design space cost 599,008 interactions; confirming one already-promising answer cost about 6,500.
If You Do Not Have That Traffic
Most sites do not, and pretending otherwise is how a testing program produces confident nonsense.
Below 1,000 visitors in each of the control and the variation, Optimizely stops counting a test as an experiment at all.
Clearing that bar is necessary and nowhere near sufficient. The sample you need comes from your own rate and the size of the effect you are hoping to see.
Below that floor, three things work better than a test.
- Fix what needs no evidence. The two-second mobile load, the shipping cost that appears at the last step, the form fields nobody reads. None of these needs a control group to justify removing.
- Ask instead of testing. An exit survey on the page that leaks reaches a usable answer at traffic levels where an A/B test would run for months.
- Measure a micro conversion. Add to cart, or the step before your form, has several times the volume of the purchase, and it moves first when the page improves.
A site that cannot fill both sides of that floor is better served by judgment and the obvious fixes than by statistics. Testing becomes the better tool once the traffic can settle an argument faster than you can.
Use this chart — embed code and citation
<a href="https://neerajjivnani.com/blog/conversion-rate-optimization/"><img src="https://neerajjivnani.com/infographics/conversion-rate-optimization/what-one-test-consumed.png" alt="Two bars on one scale from 0 to 381,024 designs, the full design space against the 111 candidates that were actually tested, which is a sliver too narrow to see. Three cards below give the cost in quantities of a different kind: 60 days of live traffic, 599,008 user interactions consumed by the search, and about 6,500 user interactions in the separate A/B test that confirmed the winner. A final table gives the result: conversion rate 5.61% to 8.22%, a 46.6% estimated improvement and a 43.5% confirmed one." width="1200"></a>
<p>Chart: <a href="https://neerajjivnani.com/blog/conversion-rate-optimization/">Neeraj Jivnani</a></p>Neeraj Jivnani, "Conversion Rate Optimization: How to Do It, and What to Fix First", neerajjivnani.com, https://neerajjivnani.com/blog/conversion-rate-optimization/Free to republish with a link back to this page.
The Tools, Sorted by the Question They Answer
Buy tools in the order the questions arrive. Each category answers exactly one of them, and the last category is the only one that cannot work on its own.
| The question | What answers it | What it cannot do |
|---|---|---|
| What is happening? | Web analytics, funnel reports, path reports | Tell you what a visitor was trying to do |
| Where exactly? | Session replay, heatmaps, scroll and click maps | Explain the behavior it shows you |
| Why? | On-site surveys, exit surveys, post-purchase questions | Give you a number you can trust as a measurement |
| Did the change do anything? | Experimentation platforms running A/B and multi-variant tests | Work at all below the traffic floor above |
The first category is the one you almost certainly have already and probably do not read closely. A funnel report built on your own macro conversion will name the pages worth working on, at no extra cost.
Choosing between products inside a category is a smaller decision than it looks. The category decides what you can learn, and the order you buy them in decides how fast you learn it.
Where Conversion and Search Optimization Overlap, and Where They Stop
Search engine optimization (SEO) decides how many people arrive, and conversion rate optimization decides what share of them act.
The overlap is the small set of changes that serve both jobs at once.
That set is short and worth knowing: page speed, mobile usability, a page whose purpose is obvious on arrival, and copy that keeps the promise the search result made.
Speed is the clearest case. The 53% who leave a mobile page slower than two seconds are lost to both jobs at the same moment, before either has been tested.
Then the two part company. Raising a conversion rate on a page nobody reaches earns nothing, and rising in the results with a page that cannot close earns traffic and no revenue.
The practical consequence is a sequencing one. If your traffic is flat and your rate is at the low end of the published bands, the page is the thing to fix first.
Five Practices Worth Copying, and Why Copying Results Does Not Work
Five practices are worth copying, because each one rests on something published that you can go and check.
- Show the total cost early. Shipping, tax and fees belong on the product page, not at the third step of a checkout.
- Get mobile pages under two seconds. Everything else on the page is an argument nobody has reached yet.
- Offer free shipping, even behind a minimum order. A shipping threshold is a conversion lever rather than a logistics setting.
- Cut the form down to the fields you need. A field nobody uses is a chance to abandon that you bought for nothing.
- Put calls to action inside the content, not only at the end. A reader convinced in paragraph four should not have to scroll to act on it.
Two Confident Assumptions, Both Disproved
The superstition is not any single tactic. It is the belief that a tactic which worked on somebody else's page will work on yours.
Two of Optimizely's own case studies are the argument against it.
In the first, a designer testing a book cover in an email assumed the real cover would beat an abstract version, and used the real one in most sends.
The abstract version won. Both illustrations were too small to read, and the abstract one showed at a glance what the book was about.
In the second, a team at Virgin Media predicting each customer's next best action assumed a customer arrives with one kind of request. The same customer turned up wanting support one day and an upgrade the next, so the model had to change.
Both are confident assumptions by competent people, disproved by measurement.
Copy the method, not the result.
CVR, CTR, CAC, and the Acronyms That Get Swapped
Three acronyms get used as though they measure the same thing, and each one answers a different question.
| Acronym | In full | The sum | What it tells you |
|---|---|---|---|
| CVR | Conversion rate | Conversions divided by visitors | Whether the page persuaded the people who arrived |
| CTR | Click-through rate | Clicks divided by impressions | Whether the message persuaded people to arrive |
| CAC | Customer acquisition cost | Spend divided by customers won | What each of those conversions cost you |
The difference between the first two is where the reader was standing when it was earned.
A click-through rate is earned in a search result, an advertisement or an email, before anybody has seen your page. A conversion rate is earned on the page itself.
Reading them together is more useful than either alone. A high click-through rate with a low conversion rate is a promise the landing page did not keep, and the fix is on the page rather than in the advertisement.
Acquisition cost is the counterweight to both. It is the number that tells you whether a rising conversion rate is a genuine improvement or the result of buying narrower, more expensive traffic.
What to Fix First
Start by naming the one macro conversion the site is judged on, and the visitor count you divide it by. Write both down. The question that brought you here was probably whether your number is good, and it cannot be answered before that.
Then read a funnel report against them. The page with the biggest drop is the one to work on first, and the order stops being a judgment call once that report is on the screen.
Take the fixes that need no evidence before the ones that do, because evidence is the expensive part.
Testing comes after that, and only once you are well clear of the 1,000-visitor floor. Below it, an exit survey on the leaking page will teach you more in a week than an underpowered test will in a quarter.
And when tests do run and keep losing, look at how they were set up before you blame the ideas.
Published averages are a sanity check on the order of magnitude and nothing more. On beauty alone they run from 5.39% down to 1.1%, on rows three companies drew differently.
Your own last quarter, on the definition you wrote down at the start, is the only comparison that holds still.