What Audience Targeting Is, and How Narrow to Make It
Choose who sees your ad without shrinking it past what a platform can deliver. The methods, where the data comes from, and what to cut first.


/ On this page9 sections
Audience targeting is choosing who sees your ad. You describe a group of people, the platform finds the ones it thinks match, and everyone else never sees the thing you made.
That description is the decision, and every attribute you add to it makes the group smaller.
So the question worth answering is not which targeting type is best. It is how narrow to make the description, and what to cut when you have gone too far.
What Audience Targeting Decides for You
The groups you can pick from are built from attributes: who somebody is, where they are, what they seem interested in, what they have done.
The payoff is spend, not relevance. A budget shown to everybody is mostly spent on people who were never going to buy, and narrowing it is how a small budget competes with a large one.
The cost is the mirror of that.
Every person you exclude is a person who cannot convert, including the ones you excluded by accident.
Both halves are real, and the second one is where the work is.
Targeting, Segmentation and a Target Audience Are Not Interchangeable
Targeting, segmentation and a target audience get used as synonyms. They are three different things.
A target audience is a description of who you are for. It exists whether or not you ever buy an ad, and it comes out of your customers rather than out of a platform.
Segmentation is the dividing. You take a market or a customer base and cut it into groups that behave differently, which is analysis and produces no campaign on its own.
Audience targeting is the choosing and the buying. It takes one of those groups, translates it into attributes a platform will accept, and spends money against it.
The translation step is where most of the loss happens.
A segment you understand well can turn into a set of platform checkboxes that describes somebody else entirely.
There is also a target market, which is broader again: the whole space you sell into, of which your audience is one part.
The Six Ways You Can Describe Somebody
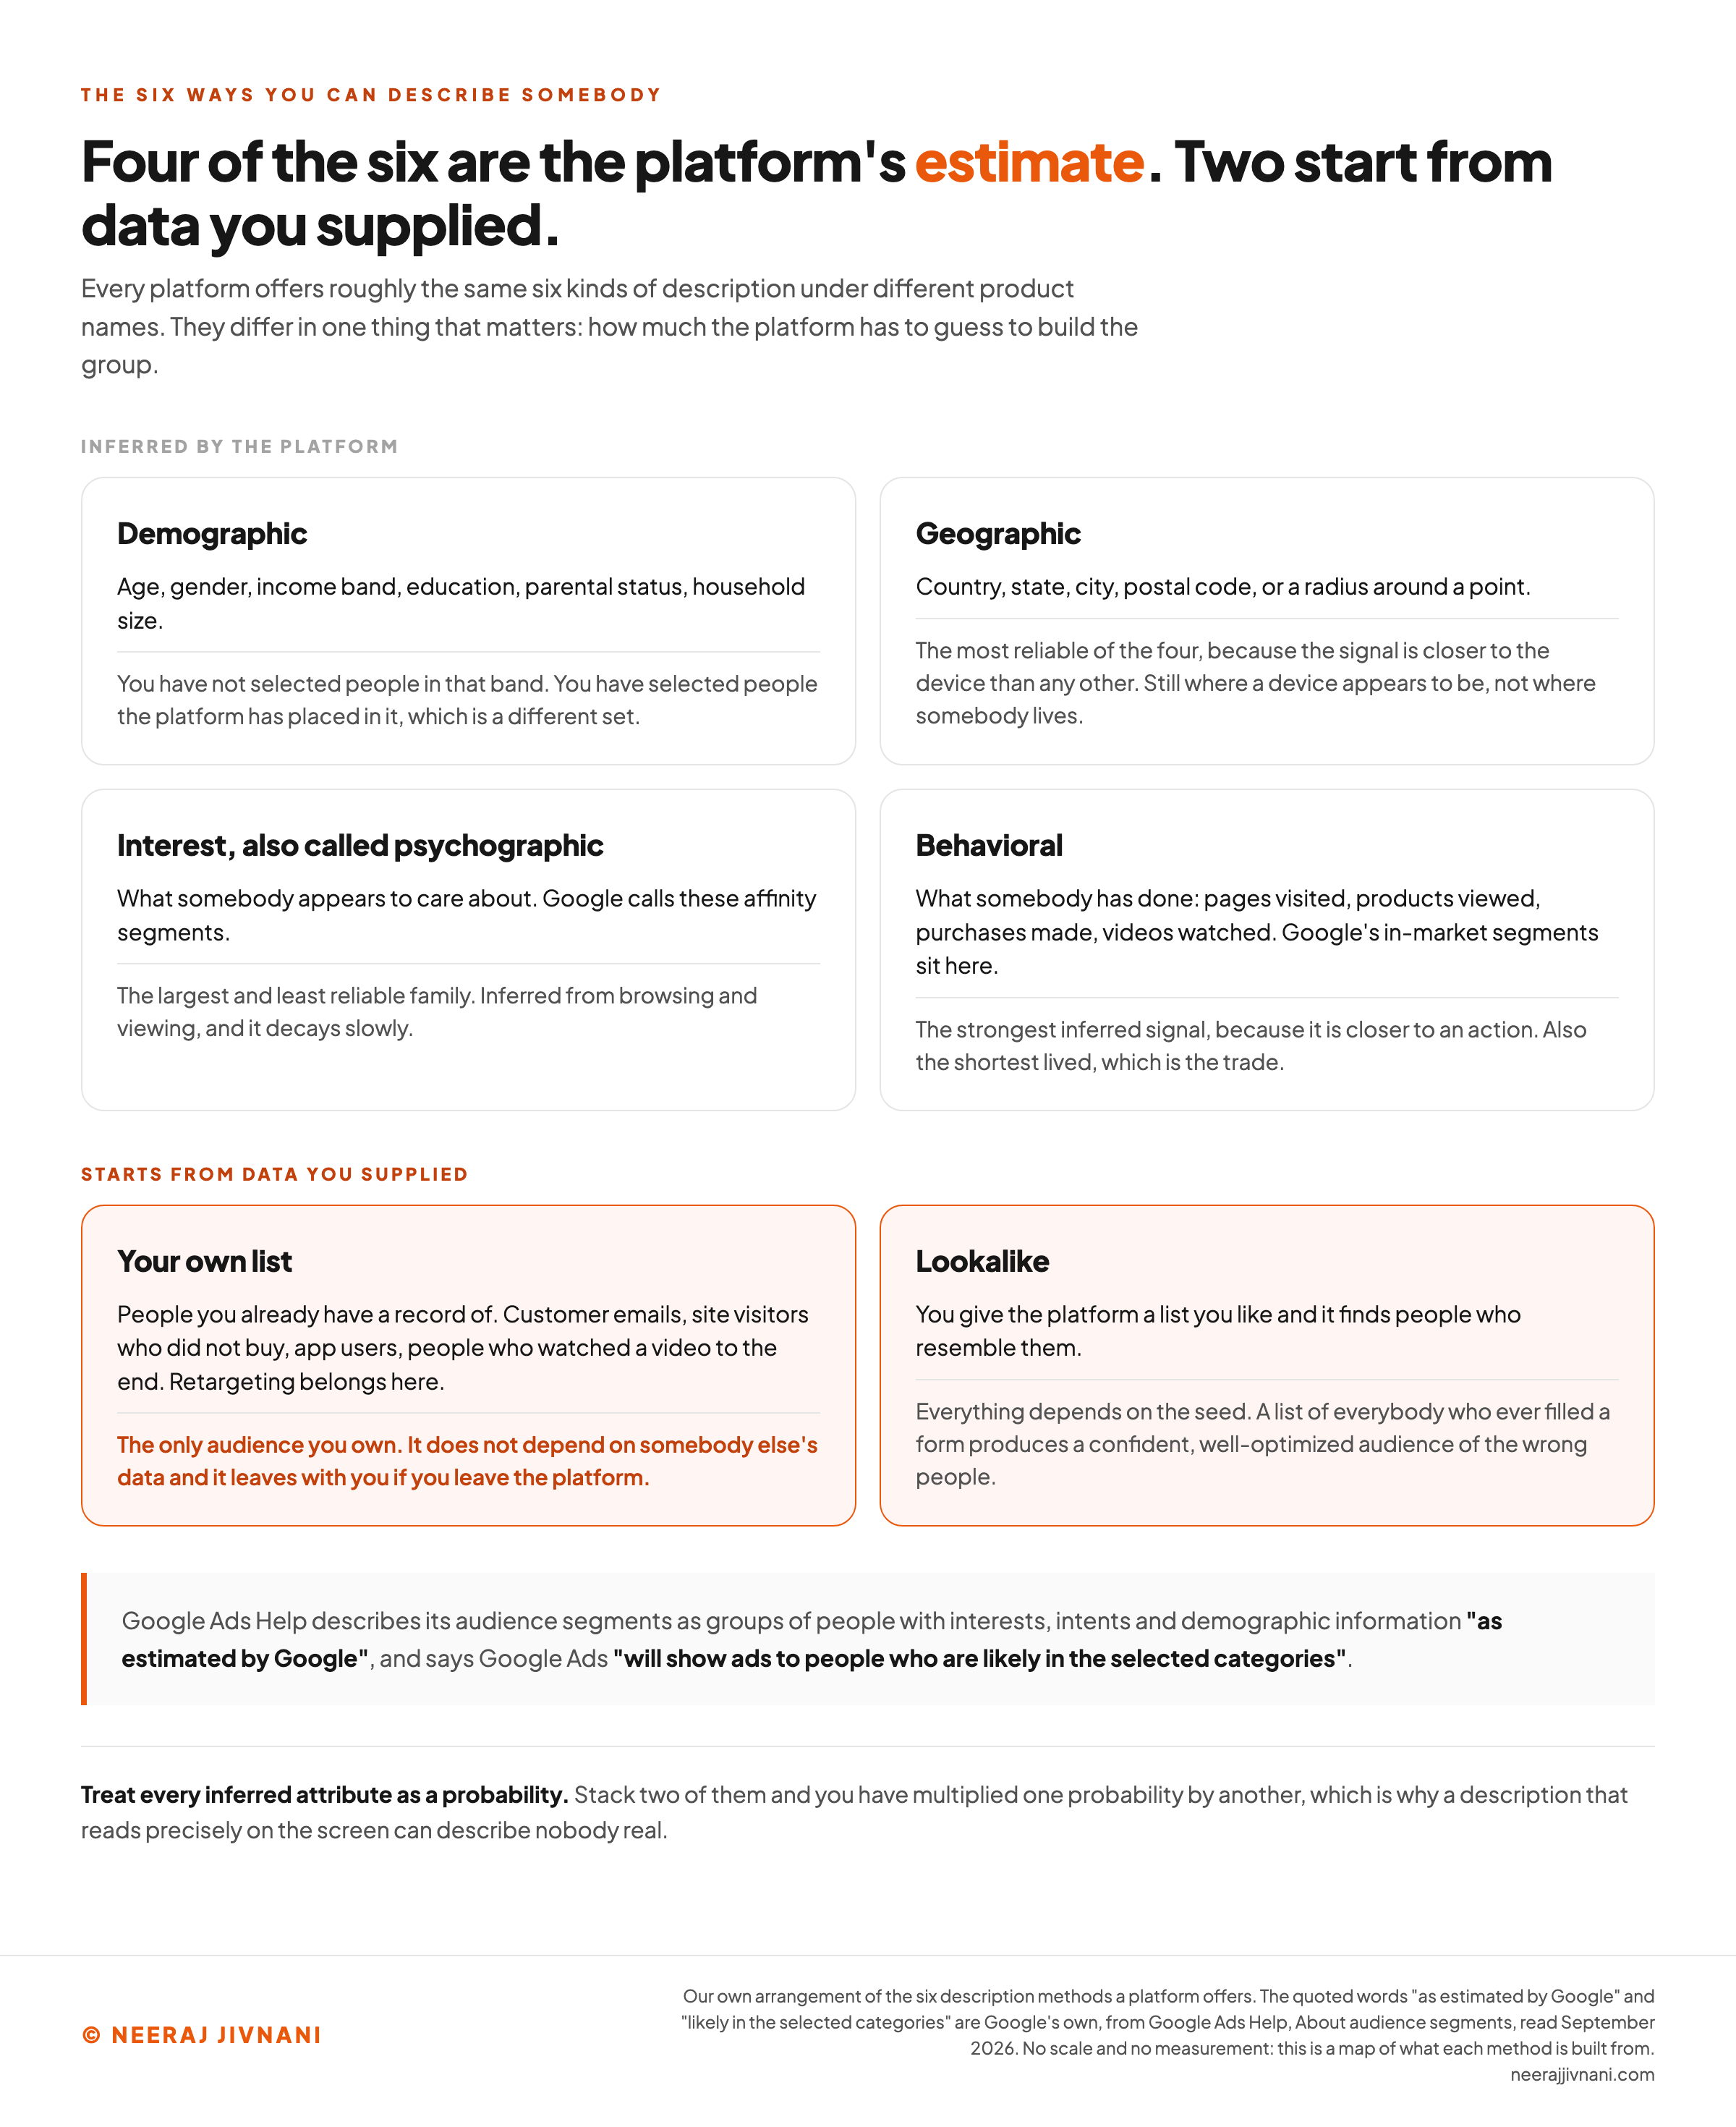
There are six underlying descriptions, and they are much the same from platform to platform. The product names are not.
They differ in one thing that matters: how much the platform has to guess to build the group.
The first four are attributes the platform infers about a person. The last two start from data you supplied.
That split is worth holding while you read the rest.
Demographic
Age, gender, income band, education, parental status, household size. The oldest form of targeting and the one people trust most.
Say you sell orthotic insoles and you tick an older age band. You have not selected people in that band.
You have selected the people the platform has placed in it, which is a different set.
Demographics are also a poor proxy for the thing you are after, which is usually a problem rather than an age.
Geographic
Country, state, city, postal code, or a radius around a point. The most reliable of the four attributes the platform infers, because the signal is closer to the device than any other.
It still is not what people assume.
A location target is where a device appears to be, not where somebody lives, so a radius around your shop catches commuters, tourists and anyone routing through a distant network.
For anything with a physical location, this is the first attribute to set and the last one to loosen.
Interest, Also Called Psychographic
Groups built from what somebody appears to care about: fitness, home improvement, luxury travel. Google calls these affinity segments.
This is the largest and least reliable family.
An interest is inferred from browsing and viewing, and it decays slowly, so somebody who researched a kitchen renovation two years ago can still be sitting in the segment.
Behavioral
Groups built from what somebody has done rather than what they seem to like: pages visited, products viewed, purchases made, videos watched. Google's in-market segments sit here, built on recent purchase intent.
Behavior is the strongest inferred signal because it is closer to an action.
It is also the shortest lived, which is the trade.
Contextual targeting sits next to this one and is a different thing. Contextual targets the page, putting your ad beside content about a subject.
Audience targeting targets the person, and follows them onto pages about anything at all.
Your Own List
People you already have a record of. Uploaded customer emails, site visitors who did not buy, app users, people who watched a video to the end.
Retargeting belongs here too, because it is your own site behavior used as the description.
This is the only audience you own.
It does not depend on somebody else's data, and it leaves with you if you leave the platform.
Lookalike
You give the platform a list you like and it finds people who resemble them. Google calls these lookalike segments and, in Google Ads, offers them only in Demand Gen campaigns.
Everything depends on the seed.
A list of your best customers produces a useful audience. A list of everybody who ever filled a form produces a confident, well-optimized audience of the wrong people.
How Many Types Are There?
You will see four types and seven types quoted for this, and neither is a standard.
Four is what you get counting only the attributes the platform infers. Seven or more is what you get counting a platform's product names for them.
The map matters, the count does not.
Use this chart — embed code and citation
<a href="https://neerajjivnani.com/blog/audience-targeting/"><img src="https://neerajjivnani.com/infographics/audience-targeting/what-the-platform-is-guessing.png" alt="A map of the six ways a platform lets you describe somebody, split into two groups. The first group, four methods the platform infers about a person, holds demographic targeting, where you have selected people the platform has placed in a band rather than people in it; geographic, the most reliable of the four because the signal is closer to the device, though it is still where a device appears to be rather than where somebody lives; interest, also called psychographic, the largest and least reliable family, inferred from browsing and viewing and slow to decay; and behavioral, the strongest inferred signal because it is closer to an action and the shortest lived. The second group, two methods that start from data you supplied, holds your own list, which is the only audience you own, and lookalike, where everything depends on the seed. A band beneath them carries Google's own words, that its audience segments are estimated by Google and that ads are shown to people who are likely in the selected categories." width="1200"></a>
<p>Chart: <a href="https://neerajjivnani.com/blog/audience-targeting/">Neeraj Jivnani</a></p>Neeraj Jivnani, "What Audience Targeting Is, and How Narrow to Make It", neerajjivnani.com, https://neerajjivnani.com/blog/audience-targeting/Free to republish with a link back to this page.
Where the Audience Comes From Before You Can Buy It
Behind every one of those descriptions is data somebody collected, and there are three places it comes from.
Data you collected. Your customer records, your site analytics, your email list, your app. Accurate, free, already interested in you, and almost always too small on its own.
The platform's own observation. What people did while signed in to that platform's products, plus what the platform saw across the sites it has a presence on. This is where affinity and in-market segments come from.
Data somebody else collected and sold. Third-party segments assembled by data brokers and offered inside buying platforms, which is how you reach people who have never encountered you.
The three are not equal, and the third is the weakest of them by a distance.
The Cookie Question, Answered Properly
People ask whether audience targeting still works without third-party cookies. It is the wrong question, because it is a question about somebody else's data.
A list you collected does not depend on a cookie.
Neither does a platform's record of what happened inside its own products while somebody was signed in.
What depends on cross-site tracking is the third bucket, and it was the weakest bucket before any of this started. Build the first two and the answer stops mattering to you.
The Platform Is Estimating, Not Knowing
The words Google uses for what the platform is doing are estimated and likely. Both are in its own product documentation.
Google Ads Help describes audience segments as groups of people with interests, intents and demographic information "as estimated by Google".
The same page says Google Ads "will show ads to people who are likely in the selected categories", and that segments can be "estimated based on content certain groups of people are likely to be interested in".
Read that again with an ad account open.
You are not selecting women in a particular age band who like hiking. You are selecting the people a model has placed in that box, at whatever accuracy the model manages.
That is not an argument against targeting.
It is an argument for treating every inferred attribute as a probability, and every stacked attribute as one probability multiplied by another.
What That Costs on Bought Data
The bought-data end of this has been measured, which is rare in advertising.
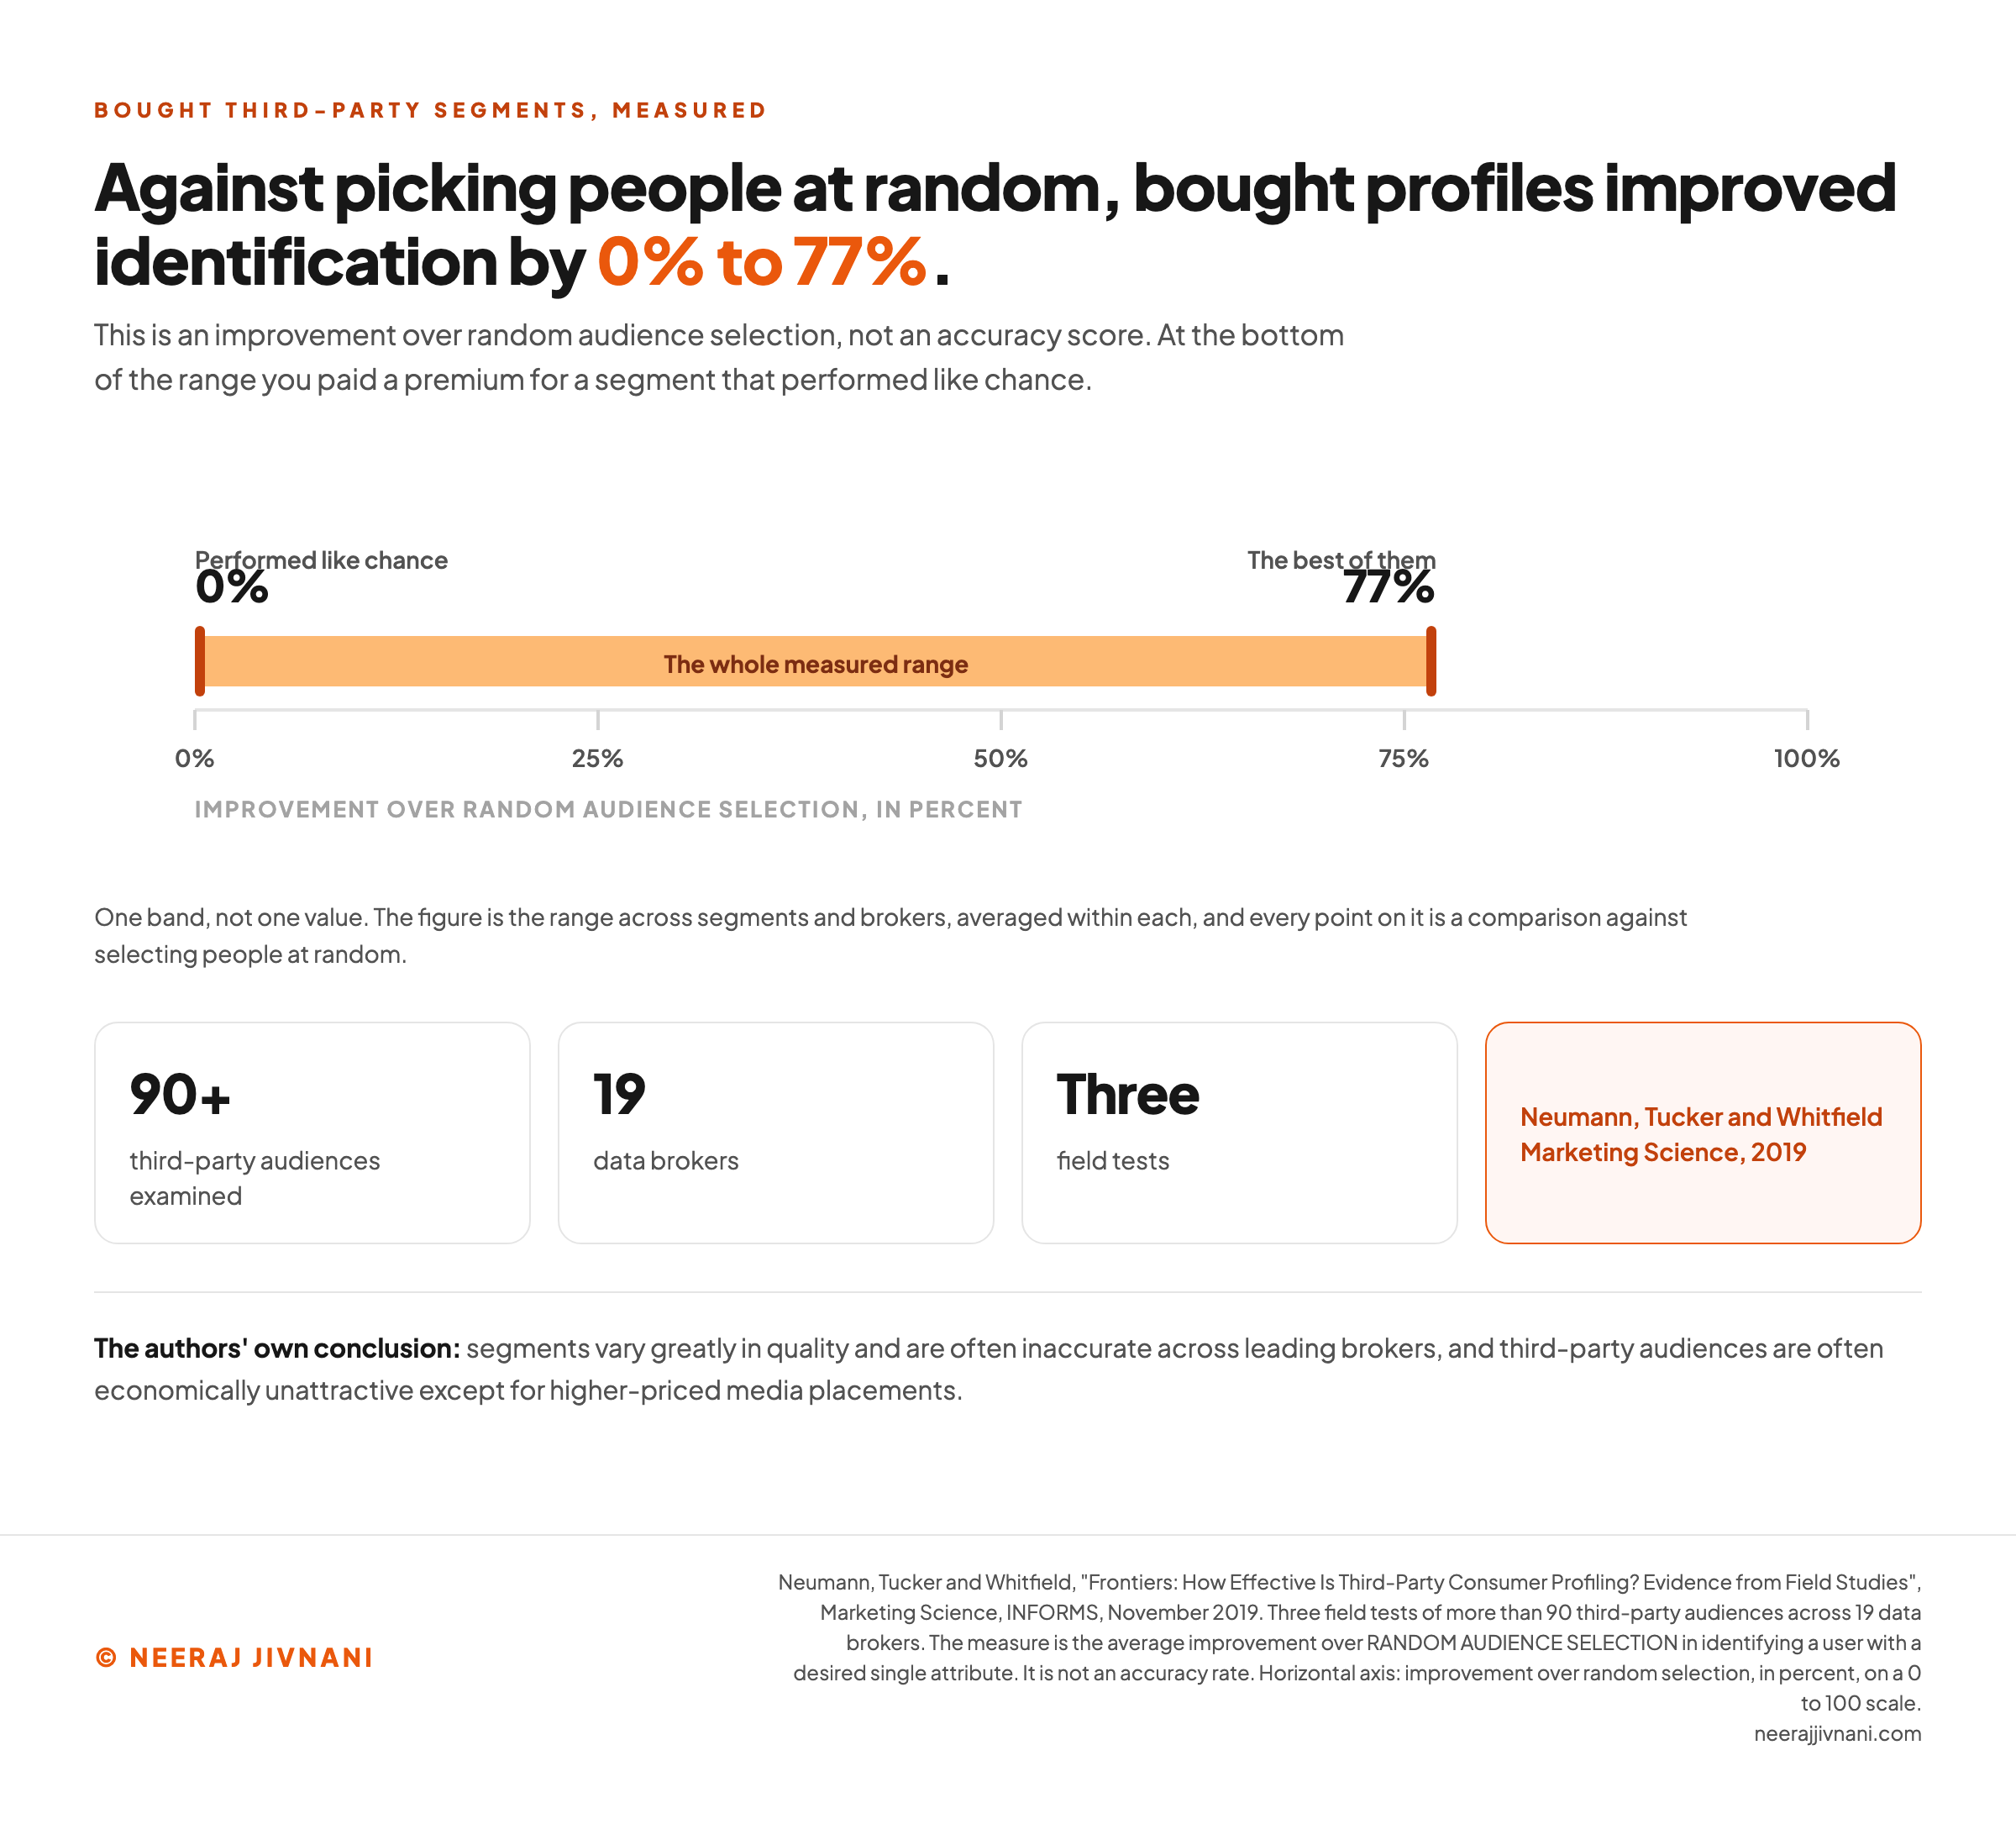
Bought segments vary greatly in quality and are often inaccurate across leading brokers, which is what Neumann, Tucker and Whitfield found across more than 90 third-party audiences and 19 data brokers in three field tests published in Marketing Science in 2019.
The number worth holding is what the profiles bought you compared with picking people at random. On average, the improvement in identifying a user with a desired single attribute ranged from 0% to 77%, depending on the segment and the broker.
That is an improvement over random, not an accuracy score, and the distinction matters. At the bottom of that range you paid a premium for a segment that performed like chance.
Given the high extra costs of targeting solutions and the relative inaccuracy, third-party audiences are often economically unattractive except for higher-priced media placements, the authors concluded.
That is a purchasing decision, and it is ours too. Buy third-party data last, test it against a broad audience rather than against your assumptions, and stop paying the moment it fails to beat the control.
Use this chart — embed code and citation
<a href="https://neerajjivnani.com/blog/audience-targeting/"><img src="https://neerajjivnani.com/infographics/audience-targeting/improvement-over-random.png" alt="A single horizontal range band drawn on an axis running from zero to one hundred percent, labeled improvement over random audience selection. The band starts at 0% and ends at 77%, with the lower end marked as having performed like chance and the upper end as the best of them. A note under the axis states that this is one band and not one value: the range runs across segments and brokers, averaged within each, and every point on it is a comparison against selecting people at random rather than an accuracy rate. Tiles below record the scope, more than 90 third-party audiences, 19 data brokers and three field tests, credited to Neumann, Tucker and Whitfield in Marketing Science, 2019, with the authors' conclusion that segments vary greatly in quality and that third-party audiences are often economically unattractive except for higher-priced media placements." width="1200"></a>
<p>Chart: <a href="https://neerajjivnani.com/blog/audience-targeting/">Neeraj Jivnani</a></p>Neeraj Jivnani, "What Audience Targeting Is, and How Narrow to Make It", neerajjivnani.com, https://neerajjivnani.com/blog/audience-targeting/Free to republish with a link back to this page.
How Narrow to Make It
Narrowness is the decision the whole subject comes down to, and the answer is to go broad first.
Start broad and let the platform narrow. Give it your objective, a location, a language and one or two attributes you are confident about, then leave it alone long enough to learn. AI-driven delivery systems optimize toward the people who respond, and stacking attributes on top of that mostly gets in the way.
Narrow only when the data asks you to. If the campaign is spending on an obviously wrong group, cut that group. If it is not, adding an interest is guessing with your budget.
The test for any attribute: can you name the person it excluded? "People who are not interested in fitness" is not a person. "Someone shopping for a first mortgage" is.
If you cannot name the exclusion, you have not targeted anything, you have only made the audience smaller.
When an audience is too small to deliver, drop attributes in this order: inferred interests first, then demographics, then behavior, then location. That is the order of how much the platform was guessing, and the guesses go first.
The exception is a location you sell from. A tighter radius is worth more than any interest you could add on top of it, so widen everything else before you widen that.
If the audience is still too small after all of it, the problem is not the targeting. Either the product has a smaller market than the plan assumed, or the platform is the wrong place to reach it.
Your own description, read back in the order the guesses go
Tick what is in the audience you are running now, then answer the one question that can overrule the order. Nothing here is scored. It tells you which attribute goes first when the audience is too small to deliver.
What is stacked in the description
The question that can overrule the order
Do you sell from a physical location?
Tick the attributes that are in your description, then answer the question above. Every attribute you stack makes the group smaller, and they are not equally worth keeping.
How Many Segments, and the 3-3-3 Question
People search for a rule here, most often the 3-3-3 rule in marketing. The phrase has no settled meaning: it is used as a label for several unrelated frameworks, and the only version that touches this subject is a suggestion to run three segments.
The number is not the decision. Run as many segments as you have genuinely different messages for, and not one more.
Two audiences seeing the same creative are one audience with extra reporting rows and a split budget. If you cannot write a different first line for each, merge them.
What Breaks an Audience That Was Working
Four things break an audience, and only the first is there from the start. The other three arrive quietly, after it was working.
Stacked attributes. Each extra condition multiplies the platform's error rate rather than adding to it.
Three inferred attributes stacked on each other can leave an audience that resembles nobody real.
Overlap between your own campaigns. Two ad sets targeting overlapping groups bid against each other and drive the same person's frequency up. The symptom is rising frequency with falling click-through, and the fix is exclusions between them.
Exclusions nobody updates. Existing customers, recent converters, current job applicants, people who complained. These lists are set once and then never touched, and a stale exclusion list is how a converted customer keeps seeing an acquisition ad for a month.
Lists that expire. This is the one people are genuinely surprised by. Customer Match lists carry a maximum membership duration of 540 days, and a list must have at least 100 members added or updated within that window to stay eligible, on Google Ads Help's own numbers.
So an uploaded list is not an asset that sits there.
It is a subscription you pay for in refreshes, and a list you have not touched in eighteen months may already be gone.
Consent and What Changed Inside the Account
Consent rules reach the ad account as published product restrictions, and those are the version worth knowing.
Since early March 2024, Customer Match lists activated on Google Partner Inventory or third-party exchange websites in the European Economic Area, including the UK and Switzerland, are no longer available for web and app, a restriction Google Ads Help publishes.
As Apple's App Tracking Transparency policies took effect, data segments and Customer Match segments may be affected on iOS 14 traffic, including their use as exclusions, the same page notes.
Read those two together and the pattern is not the one you would expect. Both restrictions land on your own list, and neither of them touches whether you hold it.
One narrows where the list can be activated. The other may narrow whether it matches at all, on iOS 14 traffic.
Google Ads and Display & Video 360 will continue to enable advertisers to use their own first-party data across Google's owned and operated properties, the same page says.
Our position is simple. Treat consent as a design constraint rather than a compliance chore, and collect only what you will use.
Then put the effort into the audiences that are yours, because a policy update can narrow where you use them and cannot take the list itself away.
Telling Whether the Targeting or the Message Was Wrong
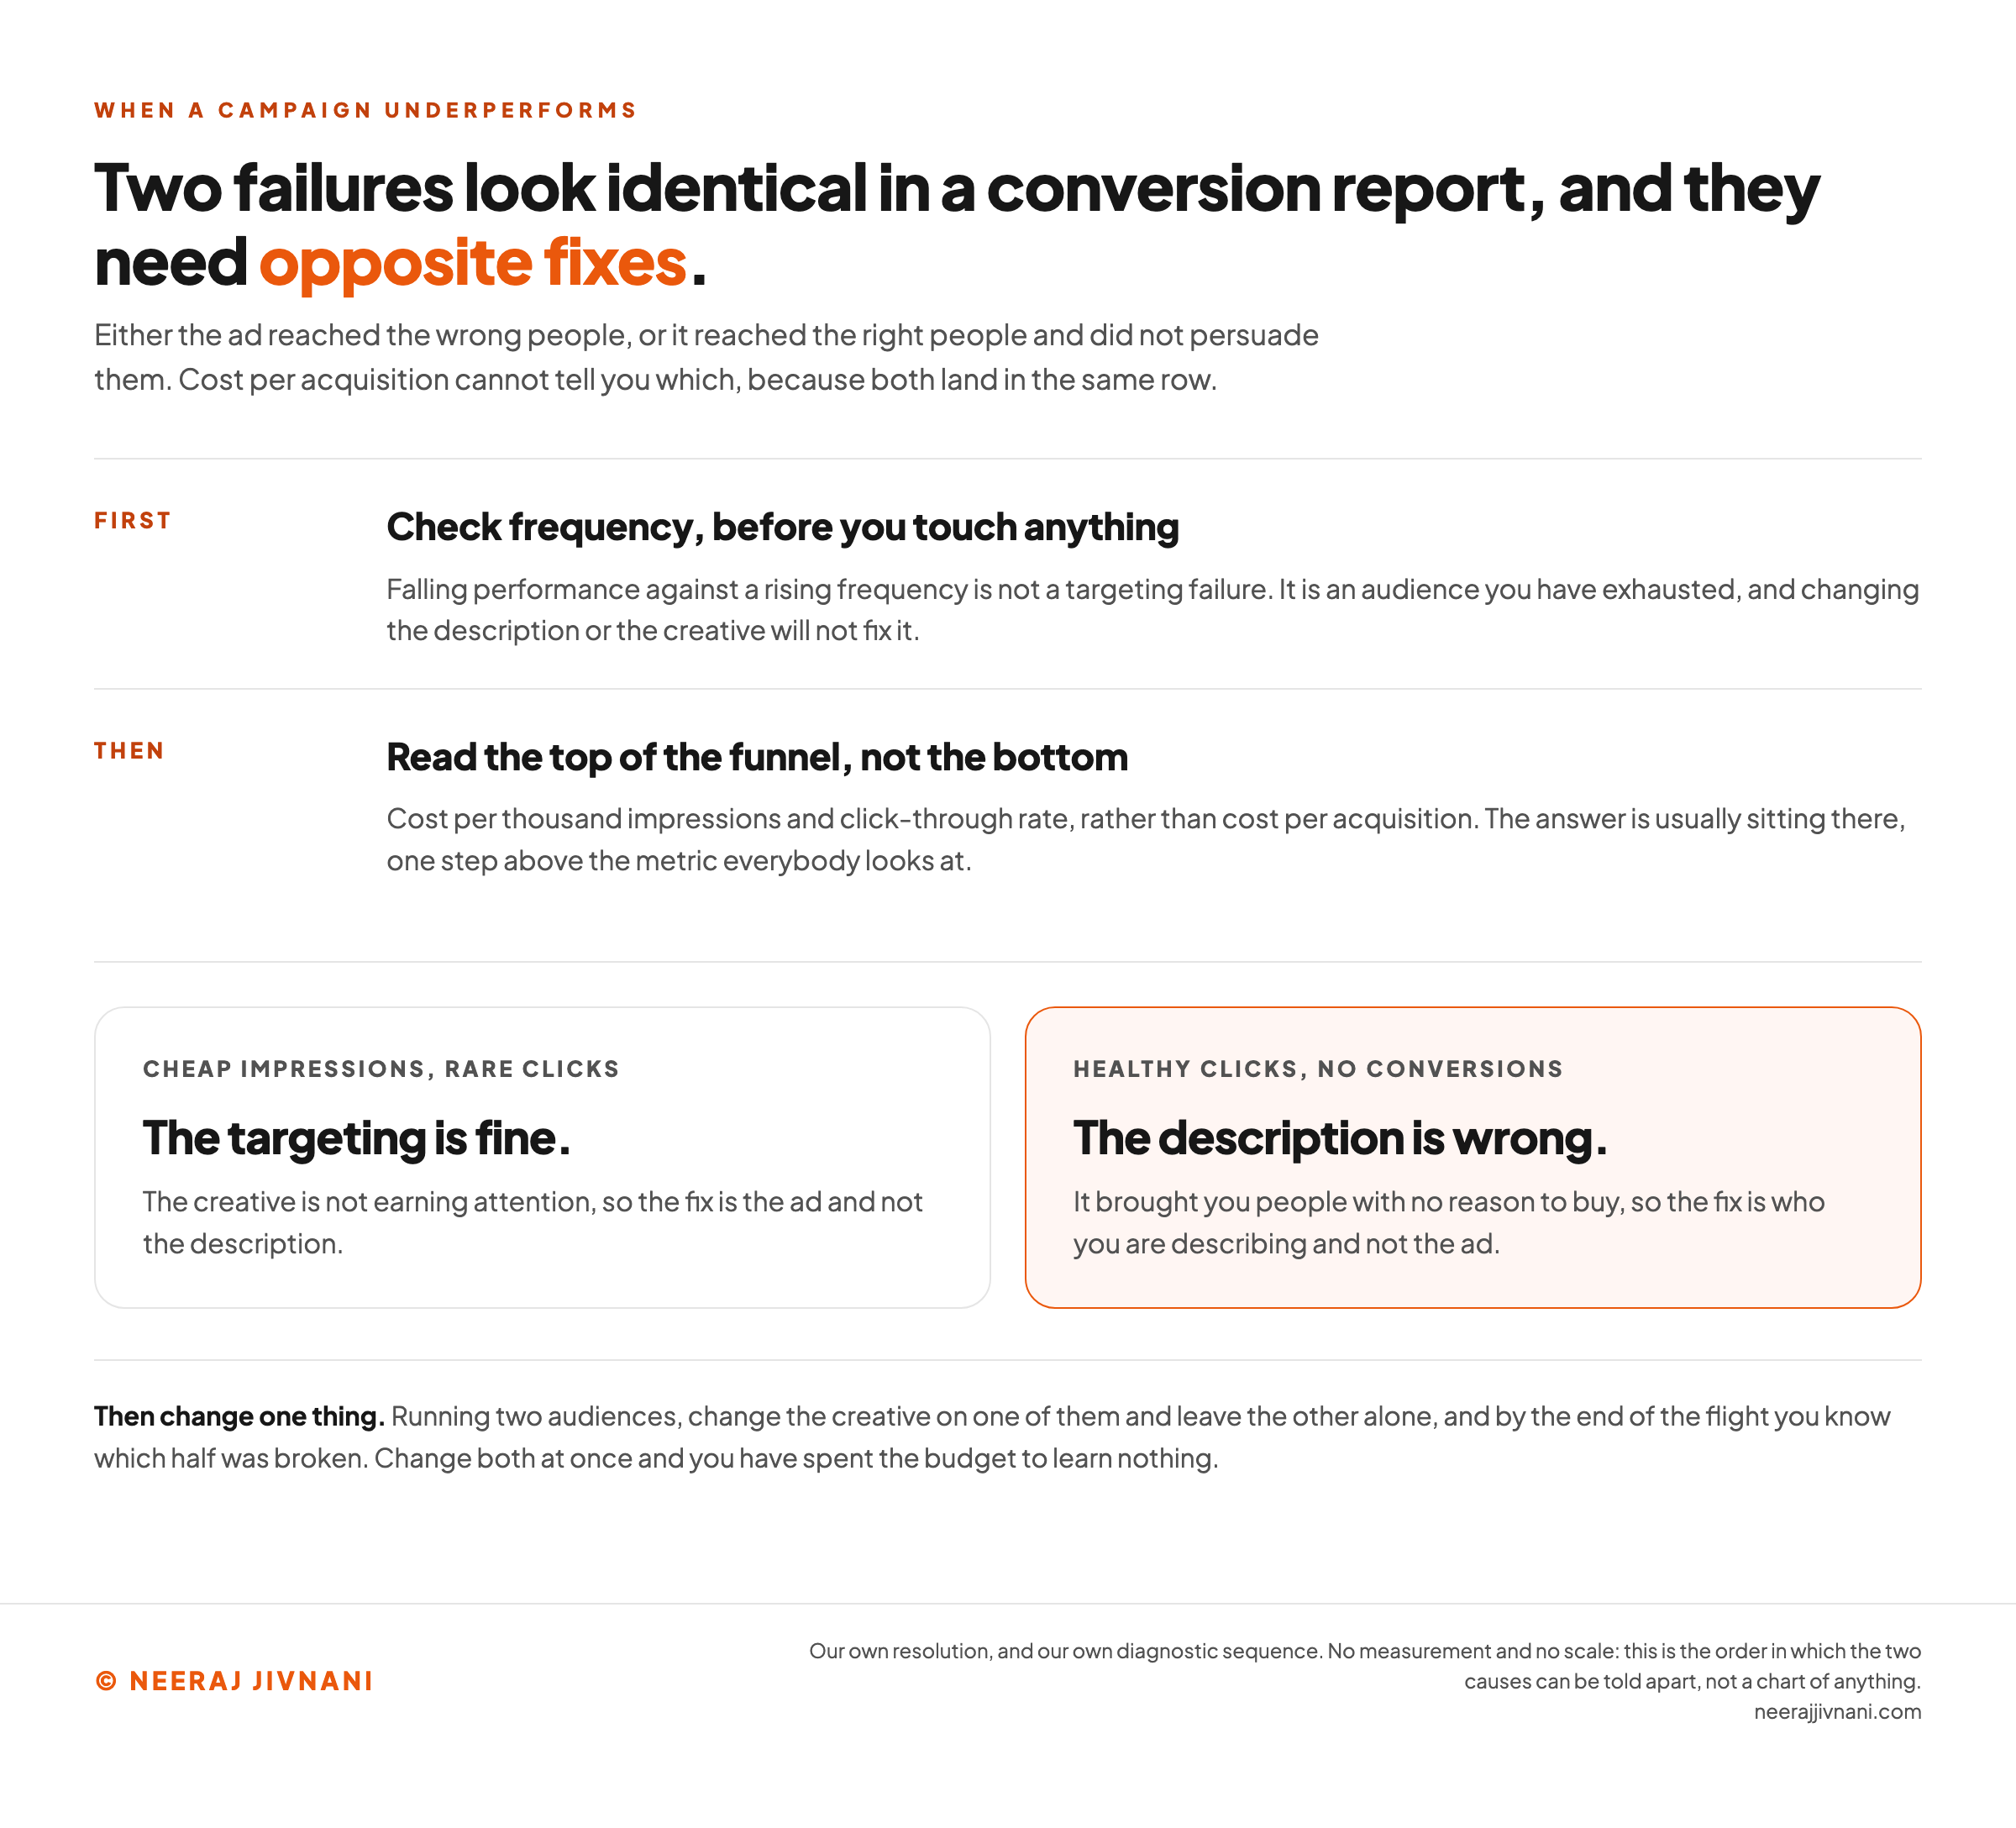
When a campaign underperforms, two causes account for most of it. Either the ad reached the wrong people, or it reached the right people and did not persuade them.
The two look identical in a conversion report, and they need opposite fixes.
Check frequency before you touch anything, because it rules out a third cause that resembles both.
Falling performance against a rising frequency is not a targeting failure. It is an audience you have exhausted, and changing the description or the creative will not fix it.
If frequency is flat, read the top of the funnel rather than the bottom: cost per thousand impressions and click-through rate, rather than cost per acquisition.
Cheap impressions and rare clicks usually mean the targeting is fine and the creative is not earning attention. Healthy clicks and no conversions mean the description brought you people with no reason to buy.
The breakdown that usually holds the answer is the Audiences report, which in Google Ads sits inside the Campaigns menu and reports on audience demographics, segments and exclusions together.
Change One Thing, and Give It a Flight
Say the insole campaign is running against two audiences and neither is converting.
Change the creative on one of them, leave the other alone, and by the end of the flight you know which half was broken.
Change both at once and you have spent the budget to learn nothing. That is the most common self-inflicted wound in this work, and it costs a whole test cycle every time.
Use this chart — embed code and citation
<a href="https://neerajjivnani.com/blog/audience-targeting/"><img src="https://neerajjivnani.com/infographics/audience-targeting/targeting-or-message.png" alt="A diagnostic sequence for a campaign that is underperforming, built on the point that the two possible causes look identical in a conversion report and need opposite fixes. The first step is to check frequency before touching anything, because falling performance against a rising frequency is an audience you have exhausted rather than a targeting failure. The second is to read the top of the funnel, cost per thousand impressions and click-through rate, rather than cost per acquisition. Two branches follow: cheap impressions with rare clicks means the targeting is fine and the creative is not earning attention, and healthy clicks with no conversions means the description brought you people with no reason to buy. A closing band says to change one thing, the creative on one audience with the other left alone, because changing both at once spends the budget to learn nothing." width="1200"></a>
<p>Chart: <a href="https://neerajjivnani.com/blog/audience-targeting/">Neeraj Jivnani</a></p>Neeraj Jivnani, "What Audience Targeting Is, and How Narrow to Make It", neerajjivnani.com, https://neerajjivnani.com/blog/audience-targeting/Free to republish with a link back to this page.
Building the First Audience
Build the first audience out of the customers you already have. It is the only one you own, and it costs nothing.
Then add a location, a language, and one attribute you would defend out loud. Nothing else, not yet.
Leave it running long enough to produce a readable result, and let what happens tell you which attribute to add or drop next.
The description is the decision. Narrow it only as far as the numbers have earned, and no further.