What Bounce Rate Actually Counts, and Why There Is No Number to Aim For
A bounce is not a verdict on your page. See what counts as one in your analytics today, what it means on the page you have, and when to act.


/ On this page9 sections
A bounce rate is not a score. It counts one thing: the share of visits that produced nothing else.
Whether that is a problem depends entirely on what the page was built to do. The same figure can be a page working perfectly or a page failing badly.
So this is what counts as a bounce in your analytics today, what it means on the page you have, and when the number is worth acting on.
What a Bounce Actually Counts
A bounce is a visit that arrives at your site and produces no further evidence of interest. Bounce rate is the share of visits that end that way.
The word means something narrower than it sounds. It does not measure whether someone read the page, liked it, or got what they came for.
It measures whether the visit produced a second signal.
Which second signals count has changed, and that matters because it changed your number rather than your visitors.
The older definition was purely structural: a session that viewed one page and no others was a bounce. Somebody who read for eight minutes and left counted the same as somebody who left in two seconds.
Google Analytics now works the other way round. It decides whether a session was engaged, and treats everything else as a bounce. Google Analytics Help gives three ways a session qualifies as engaged:
- it lasts longer than 10 seconds
- it fires a key event
- it includes at least two pageviews or screenviews
Any one of the three is enough. So the eight-minute reader is no longer a bounce, and the two-second visitor still is.
Bounce rate and engagement rate are therefore one measurement pointed two ways. In Google Analytics they are defined as opposites: engaged sessions on one side, everything else on the other.
If your engagement rate is 68%, the bounce rate is 32%. There is no third category.
Working the Number Out
Bounce rate is bounces divided by sessions, times 100.
Say a page takes 90 sessions and 33 of them are not engaged. That is 33 divided by 90, or 37%.
Under the older single-page definition the arithmetic is identical and only the numerator changes: single-page sessions divided by total sessions. The two formulas are the same shape, which is exactly why the change is easy to miss and easy to misread.
The 10 Seconds Is a Setting, Not a Law
The 10-second threshold is a default, and it is adjustable in your own property.
The control sits in the web data stream's tag settings, under Adjust timer for engaged sessions, where Google Analytics lets you select the number of seconds it takes for a session to be considered an engaged session.
Raise it and the reported bounce rate goes up. Nothing about your visitors changes.
That is not a flaw in the metric so much as a fact about it. A bounce is not an event that happens to a visitor.
It is a verdict your measurement passes on a visit, against a threshold somebody chose.
Bounce thresholds have always been chosen rather than discovered. Typical values run from 5 to 60 seconds, a range Sculley, Malkin, Basu and Bayardo recorded in their 2009 Google paper on sponsored search.
So before you compare your figure with anyone else's, know which threshold produced yours.
Bounce Rate and Exit Rate Are Not the Same Number
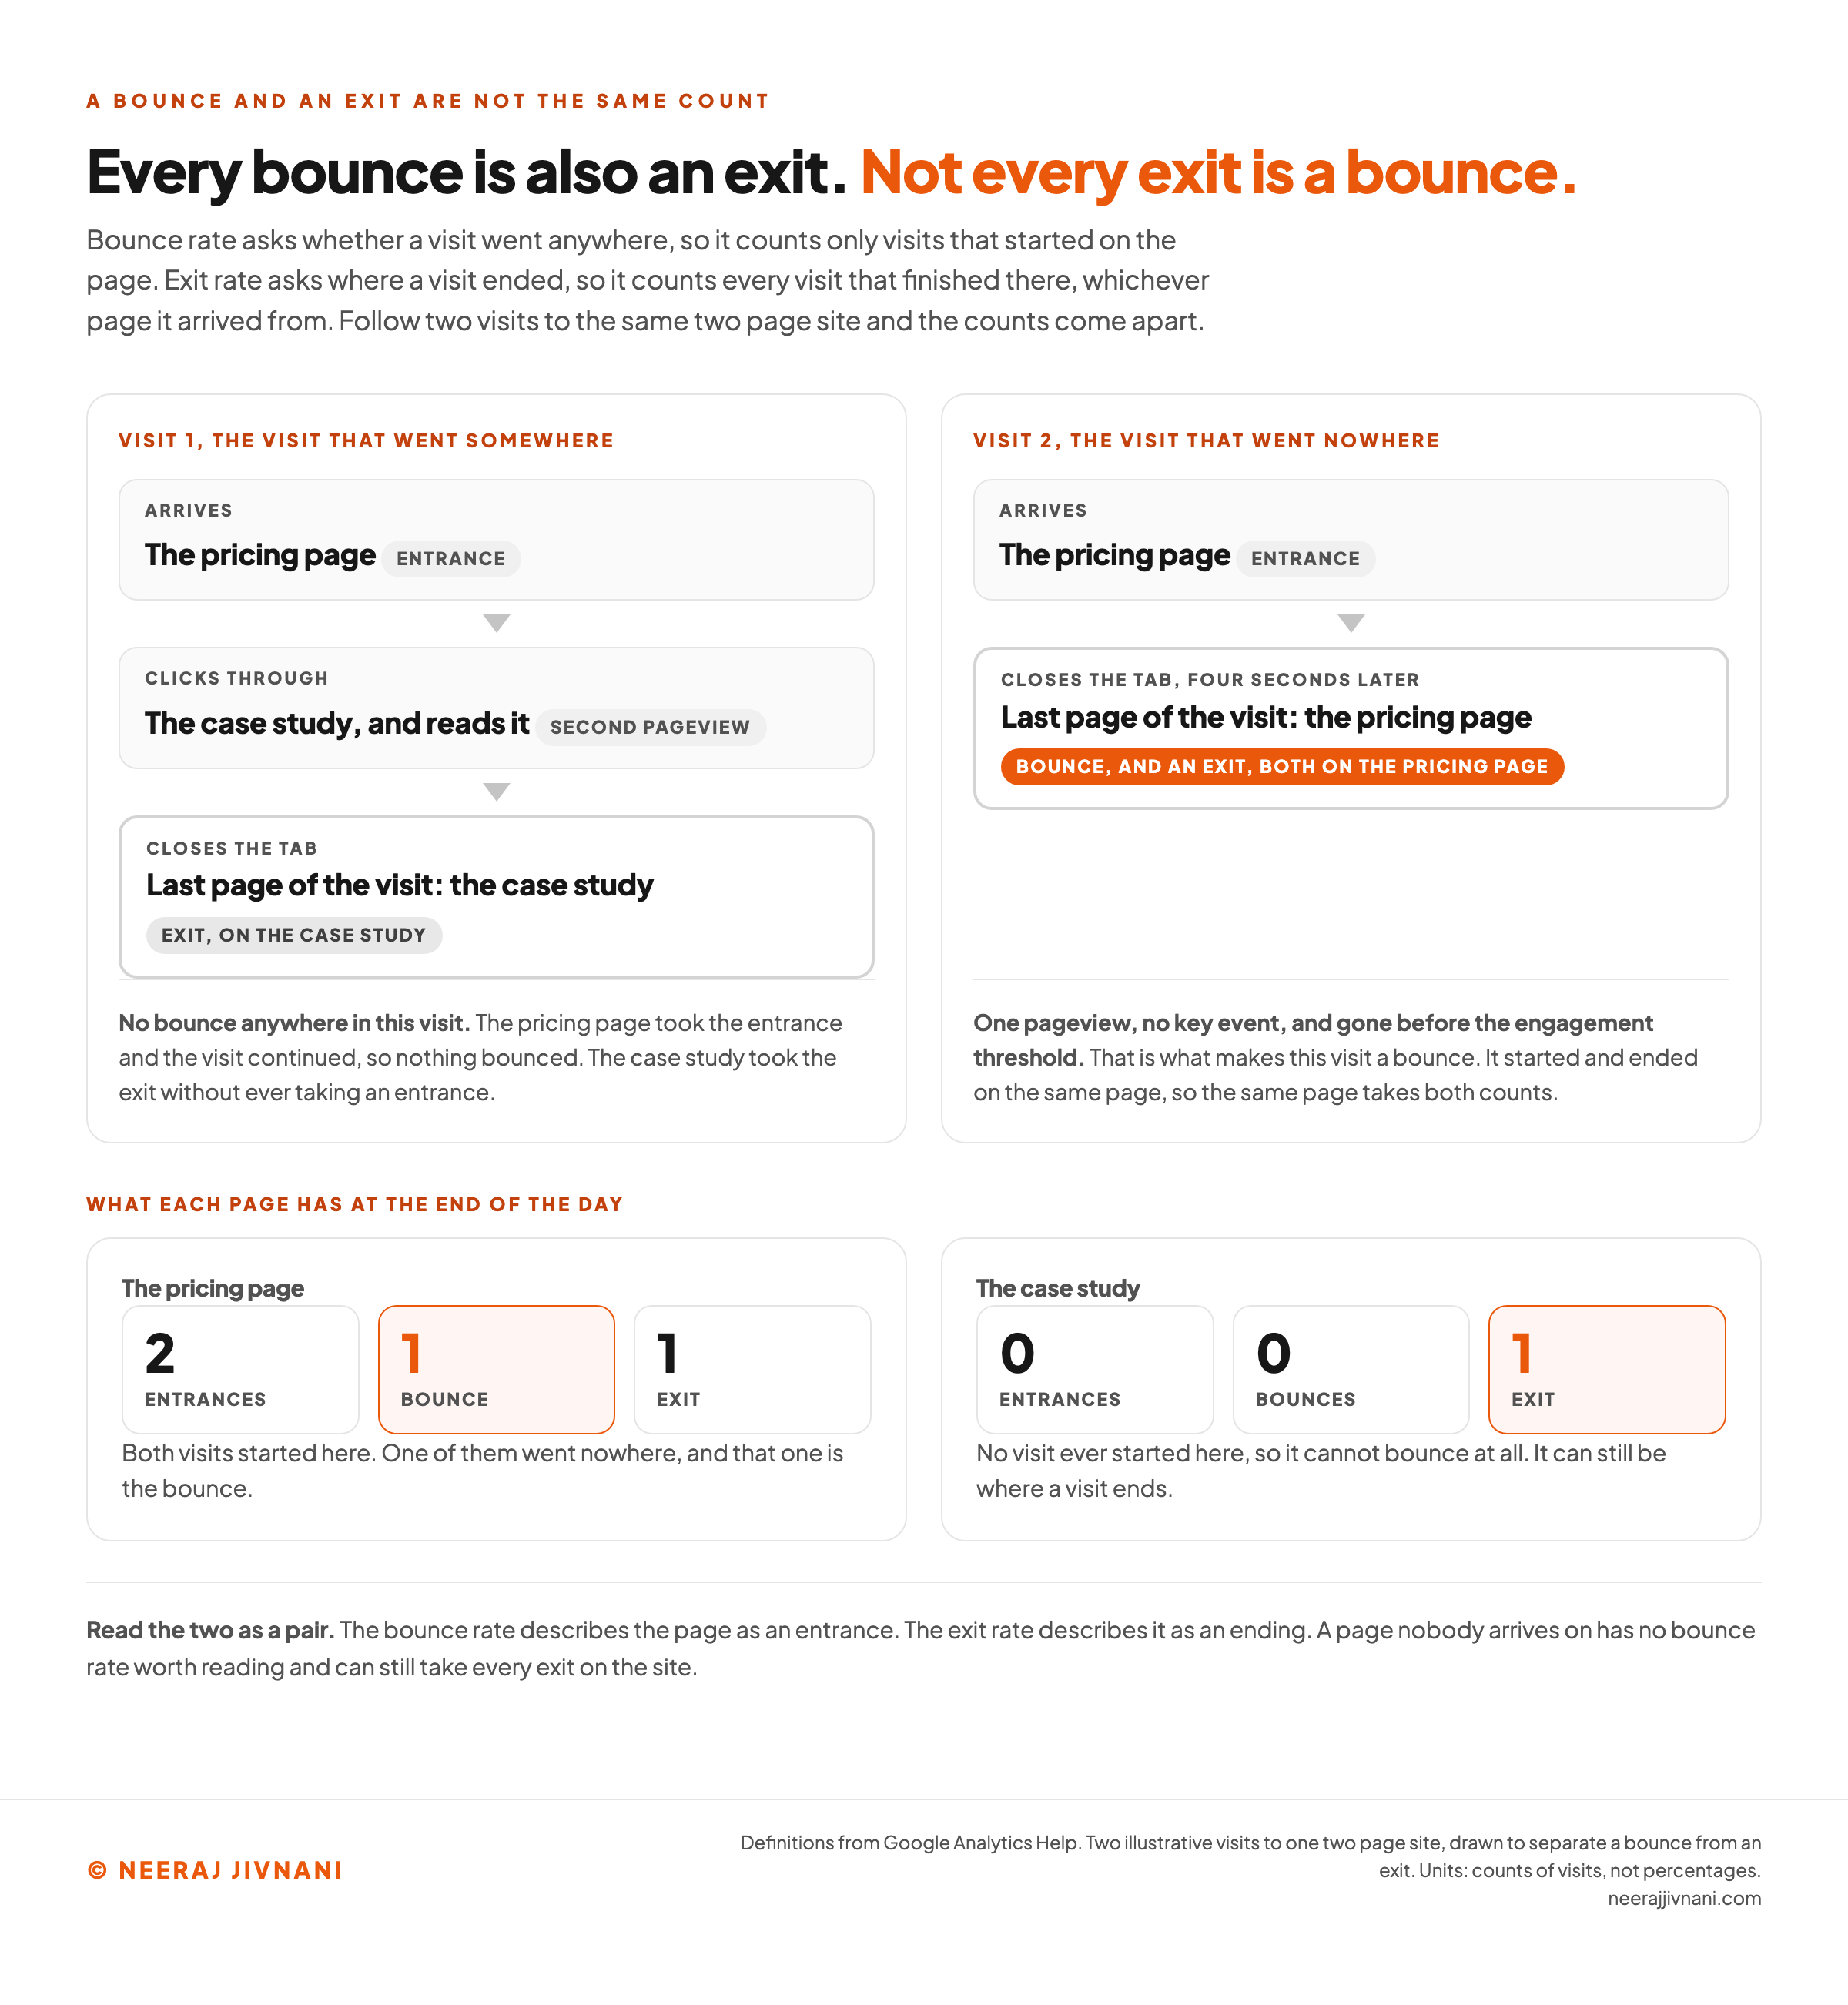
Bounce rate asks whether a visit went anywhere. Exit rate asks where a visit ended.
Every bounce is also an exit, but not every exit is a bounce.
That asymmetry is why the two numbers on the same page can be far apart.
Follow one visitor. They arrive on your pricing page, click through to a case study, read it, and close the tab.
- The pricing page took an entrance and no bounce. The visit continued.
- The case study took an exit. It was the last page of the visit.
Now follow a second visitor who lands on the pricing page and closes the tab four seconds later. That one is a bounce on the pricing page, and an exit on it too.
So the pricing page's bounce rate counts only visits that started there and went nowhere.
Its exit rate counts every visit that finished there, whether it started there or arrived from six pages deep.
A high exit rate on a checkout confirmation page is the page doing its job. A high exit rate on step two of a four-step form is not.
Read them as a pair. The bounce rate tells you about the page as an entrance, and the exit rate tells you about the page as an ending.
Use this chart — embed code and citation
<a href="https://neerajjivnani.com/blog/bounce-rate/"><img src="https://neerajjivnani.com/infographics/bounce-rate/one-path-two-numbers.png" alt="Two visitor paths drawn side by side on the same two page site. In the first path the visitor enters on the pricing page, moves to the case study and leaves, which gives the pricing page an entrance and no bounce while the case study takes the exit. In the second path the visitor enters on the pricing page and leaves after four seconds, which gives the pricing page both a bounce and an exit. Underneath, the same two page tallies are shown as counters, so the pricing page ends the day with one bounce out of two entrances and the case study with one exit and no bounce." width="1200"></a>
<p>Chart: <a href="https://neerajjivnani.com/blog/bounce-rate/">Neeraj Jivnani</a></p>Neeraj Jivnani, "What Bounce Rate Actually Counts, and Why There Is No Number to Aim For", neerajjivnani.com, https://neerajjivnani.com/blog/bounce-rate/Free to republish with a link back to this page.
What a Good Bounce Rate Is
There is no good bounce rate for a website. There are only bounce rates that fit what a page is for, and bounce rates that do not.
That is not a dodge, and it is worth being precise about why.
An industry benchmark answers the question "how does my site compare to sites like mine". It cannot answer whether one particular page needs changing, because the average of a whole site is not a description of any page on it.
You can see how little the published ranges discriminate. These are the seven rows in Plausible's 2026 benchmark table.
| what Plausible lists | its published range | is 40% inside it? |
|---|---|---|
| Retail and ecommerce | 20% to 55% | yes |
| B2B websites | 25% to 65% | yes |
| Real estate | 30% to 55% | yes |
| Travel and hospitality | 40% to 60% | yes |
| Service industries such as legal and automotive | 50% to 70% | no |
| Landing pages | 60% to 90% | no |
| Content websites | 65% to 90% | no |
A 40% bounce rate falls inside four of those seven.
So the answer to "is 40% good" is that 40% is unremarkable almost everywhere, and it still tells you nothing about the page you are looking at.
One Real Site's Own Pages, Opened
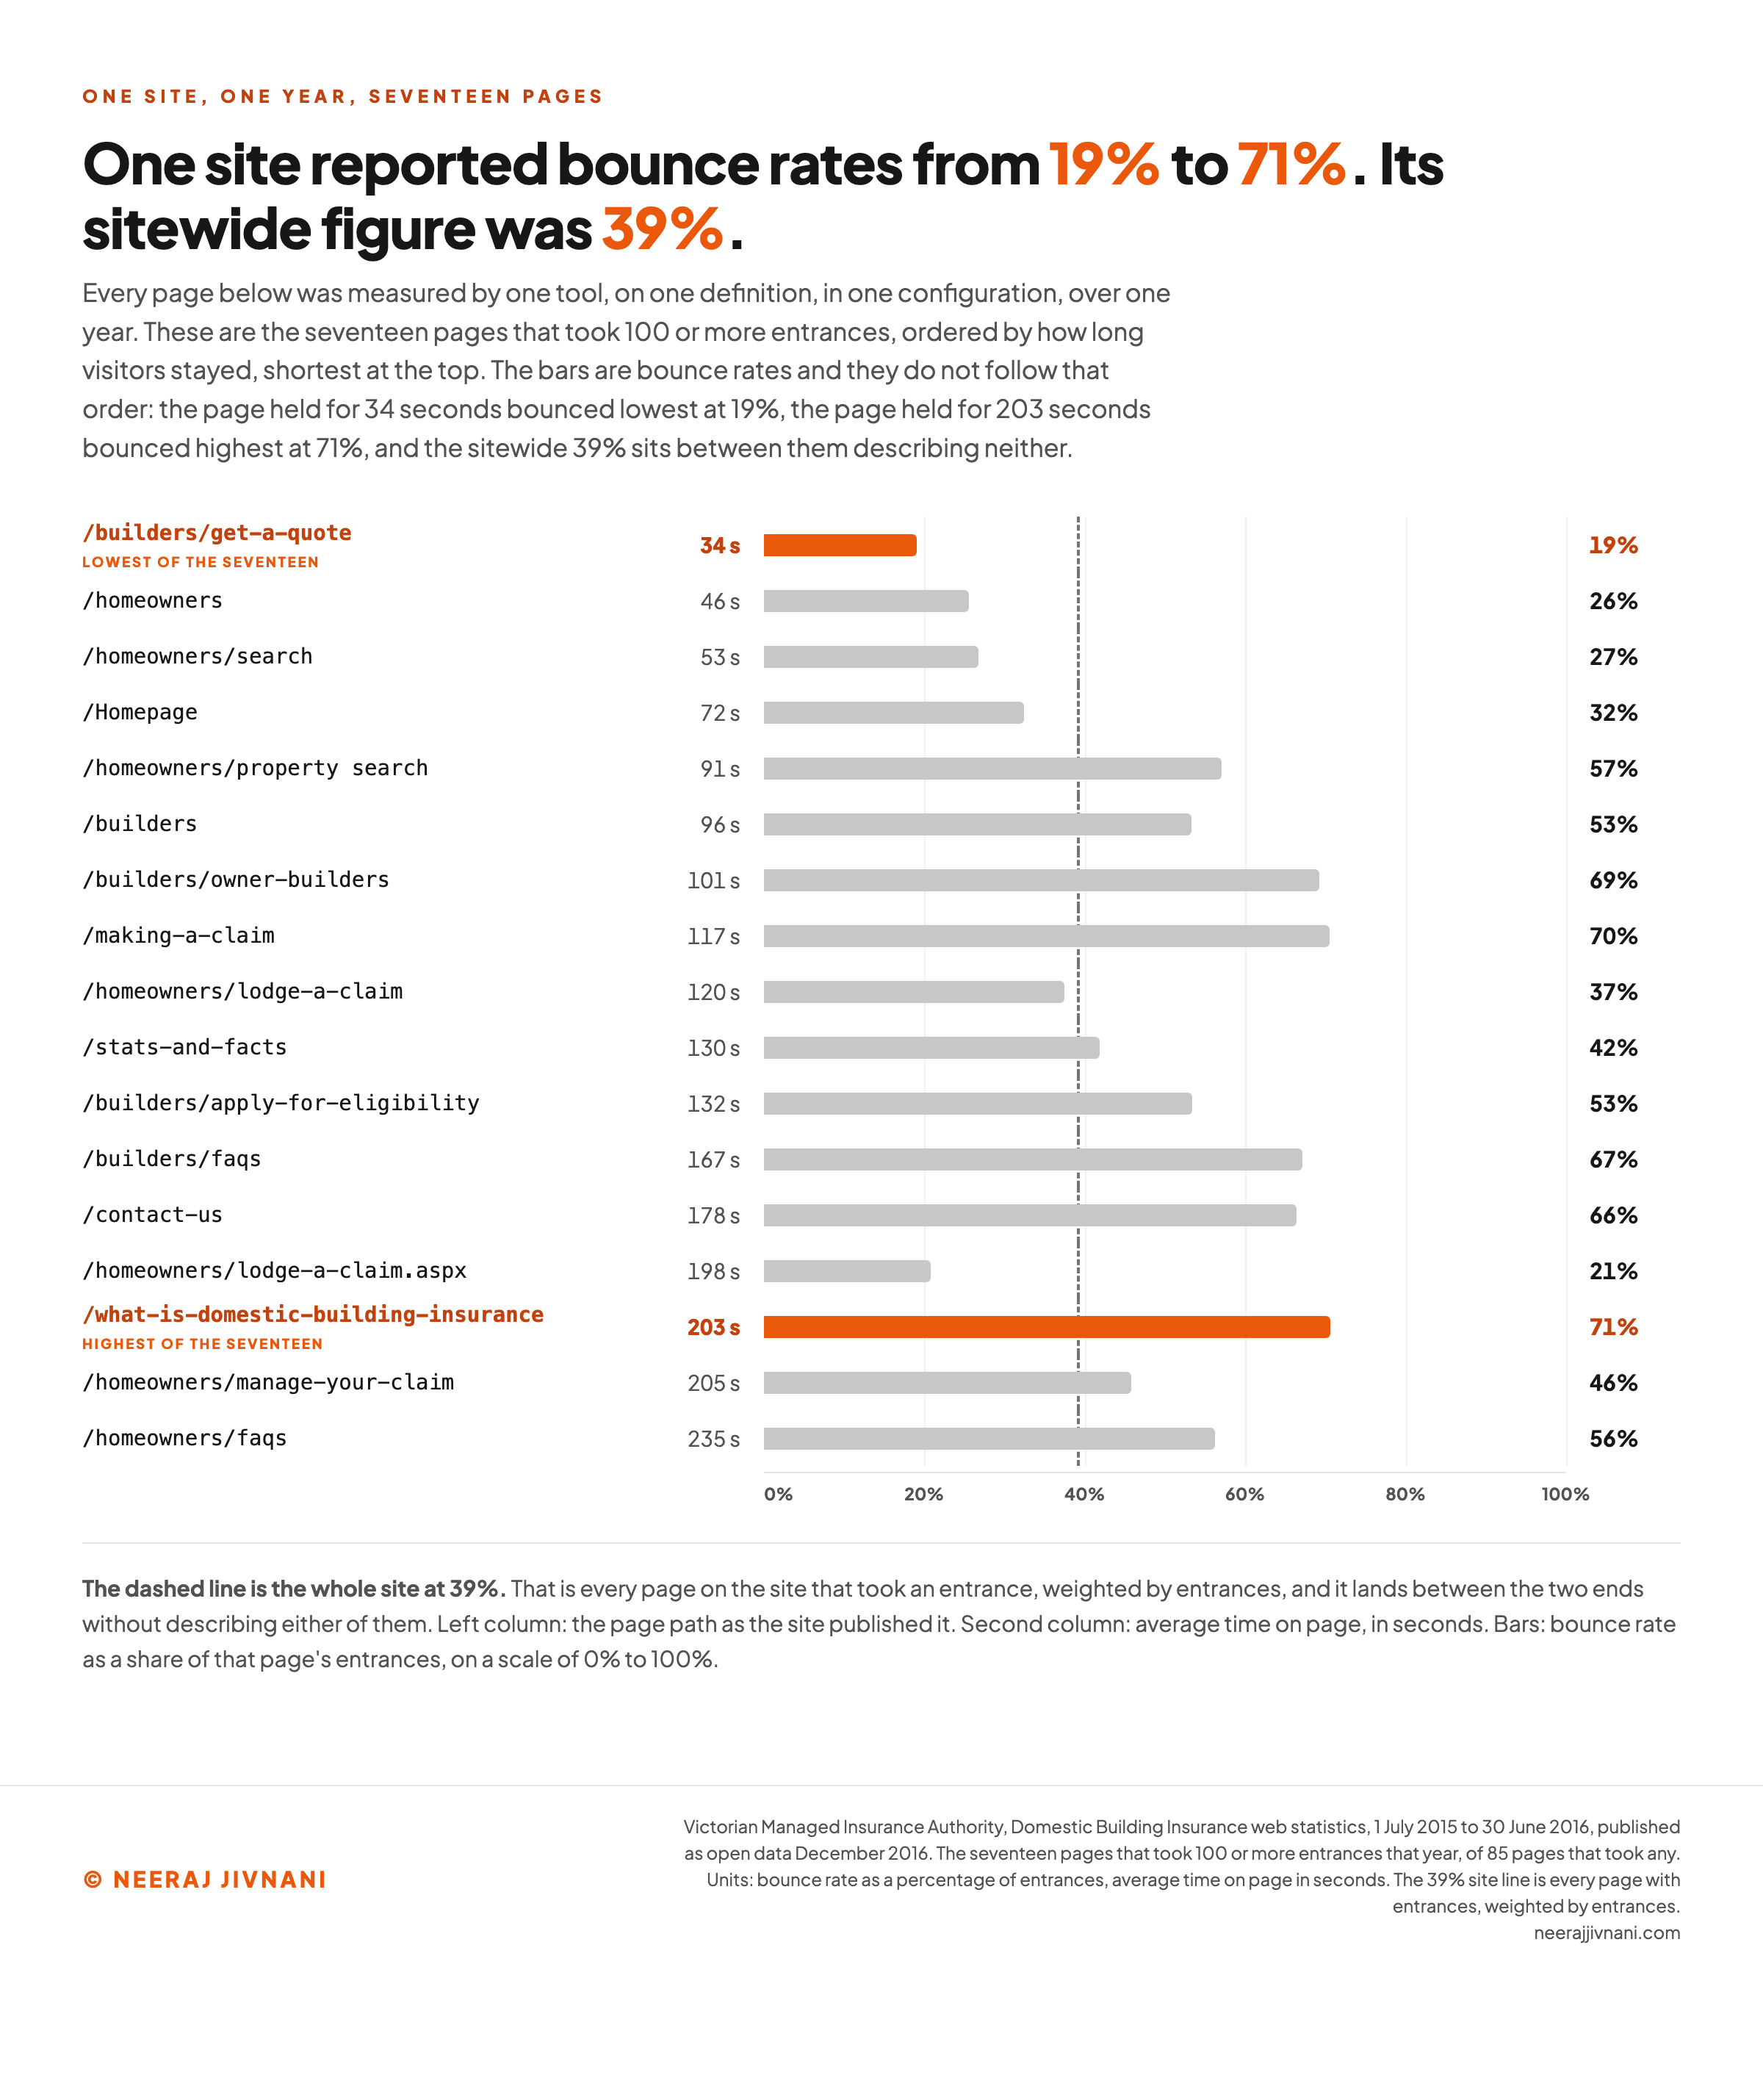
On one real website, seventeen pages took 100 or more entrances in a year and bounced anywhere from roughly 19% to roughly 71%. Those are the Victorian Managed Insurance Authority's own numbers for its domestic building insurance site, covering 1 July 2015 to 30 June 2016.
The whole site, weighted by entrances, comes out near 39%. That single figure describes almost none of them.
They predate the engagement rule, so a bounce here means what it used to mean: a visit that saw one page and no others, however long it lasted.
Look at which pages sit at each end of that range, because it is the opposite of what a score would predict.
- The highest bounce rate belongs to the page explaining what domestic building insurance is. It took 2,434 entrances, and visitors spent an average of 203 seconds on it.
- The lowest belongs to the quote page, where builders start their application. It took 689 entrances, and visitors spent an average of 34 seconds on it, the shortest of the seventeen.
So the page with the highest bounce rate held people six times longer than the page with the lowest.
Time on page will not sort them out either.
One of the claim lodgement pages held visitors 198 seconds and bounced at 21%. The explainer held them 203 seconds and bounced at 71%.
Neither number is a verdict on its page. An explainer holds someone for three minutes, answers the question, and they go.
The claim page holds them about as long and then hands them on.
The data is a decade old and that does not weaken the point, because the point is not the level. It is the spread inside one site, measured with one tool, one definition and one configuration, on pages built for different jobs.
Use this chart — embed code and citation
<a href="https://neerajjivnani.com/blog/bounce-rate/"><img src="https://neerajjivnani.com/infographics/bounce-rate/one-site-many-pages.png" alt="Seventeen pages from one real government website plotted as horizontal bars, ordered by average time on page from 34 seconds at the top to 235 seconds at the bottom, with each bar labeled with its bounce rate. The page explaining what domestic building insurance is sits third from the bottom at 203 seconds and carries the highest bounce rate of the set, highlighted in orange, and the builders quote page sits at the top at 34 seconds with the lowest bounce rate, also highlighted. Directly above the explainer, a claim lodgement page at 198 seconds carries a bounce rate 50 points lower, so two pages that held visitors for almost the same time sit at opposite ends of the bounce scale. A single line across the chart marks the whole site figure of about 39 percent, showing that it sits between the two extremes and describes neither." width="1200"></a>
<p>Chart: <a href="https://neerajjivnani.com/blog/bounce-rate/">Neeraj Jivnani</a></p>Neeraj Jivnani, "What Bounce Rate Actually Counts, and Why There Is No Number to Aim For", neerajjivnani.com, https://neerajjivnani.com/blog/bounce-rate/Free to republish with a link back to this page.
A High Bounce Rate Is Not Automatically a Problem
Ask what the page was built to do before you ask whether its bounce rate is too high.
That single question resolves most of the confusion around this metric, and it gives you four honest answers rather than one target.
| what the page is for | what a bounce means there | worth acting on? |
|---|---|---|
| Answer one question (opening hours, a definition, a phone number) | The visitor got the answer and left | No. A high rate is the page succeeding |
| Start a task (a quote request, a signup, a search) | The visitor did not begin it | Yes, and quickly |
| Sell something | The visitor did not look at anything else | Yes, and segment by traffic source first |
| Continue a task already in progress | Something broke, or the step was unclear | Yes. This is the most expensive kind |
The pattern underneath the table is that bounce rate moves with what the visitor arrived wanting.
Intent Moves the Number
Change the keyword and the number moves. Across 749 keywords sampled from Google Search, mean bounce rates varied significantly by keyword, in Sculley, Malkin, Basu and Bayardo's 2009 study of sponsored search.
Navigational queries containing specific business names bounced low. Commercial terms such as books and flights bounced low too, and entertainment terms such as games and chat bounced much higher.
Those groups are query types, and a query type is a description of what somebody is trying to do.
What a bounce means on the page you have
Take one page you are actually looking at. Say what it was built to do, put its number in, and this reads that number against that job. The same figure comes back as a page working or a page failing, depending only on the first answer.
1. What was this page built to do?
3. Have you split that number by traffic source yet?
Answer the first two and the reading appears here. It will not tell you whether your number is good, because there is no number to aim for. It will tell you what a bounce means on a page with that job.
No published range is applied to your number anywhere above, and none is coming. The comparison that works is this page against what this page was built to do, which is the only pair where both sides are measuring the same thing.
That is why segmenting matters more than benchmarking.
Before you rewrite a page whose number looks alarming, split that page by traffic source. If one source is carrying it, the thing to fix is what that source promised, not the page.
When It Is Worth Fixing, and What Actually Causes It
Fixing a bounce rate is worth doing only when the number does not fit the page.
Take the objection first, though, because it is a good one. If bounce rate is this easy to misread, why watch it at all?
Because it does carry real signal, and that has been measured.
Ads rated excellent bounced at less than half the rate of ads rated bad, on the paper's normalized scale, and mean bounce rate fell in every successive rating bin from bad to excellent.
That came from 7,000 advertisements in the same 2009 Google study, rated on the landing page alone by evaluators who knew nothing about the bounce rates.
The same paper found ads that followed Google's advertising quality guidelines had a mean bounce rate 25.4% lower than ads that did not, significant at p below 0.0001.
So the metric is not noise. It correlates with page quality when you hold intent still.
The trap is that a sitewide figure does not hold intent still, and neither does a comparison against an industry range. Only a page held against its own job does.
Check in This Order
When a page's bounce rate genuinely does not fit what the page is for, work down this list. It is ordered by cost to check, cheapest first, so the expensive investigations only happen if the cheap ones come back clean.
- Is the page broken for anyone? A JavaScript error, a redirect loop, an expired certificate warning, a 404 reached through a live link. Load it in a private window on a phone and on a laptop before you touch anything else.
- Does the page deliver what brought them? This is the cause the metric is best at detecting. If the title in the result, the ad, or the link promised one thing and the page opens on another, people leave in seconds and no amount of design fixes it.
- Is it readable before it is loaded? A visitor staring at blank space is deciding whether to wait. Core Web Vitals exist to measure exactly that experience, and a page that fails them is a page some people never see. That is a site speed optimization problem, not a copy one.
- Does it work on a phone? Tap targets, readable type, no horizontal scroll. Check on a real device, not a resized browser window.
- Is anything in the way? An interstitial, a cookie wall stacked on a newsletter modal, autoplaying audio. Each one is a reason to leave before the page has said anything.
Notice what is not on that list: making the page longer, adding related links to manufacture a second pageview, or setting a target percentage. The first two move the number without helping anybody, and the third is how a team ends up optimizing a measurement instead of a page.
What 0% and 100% Usually Mean
Check the tracking, not the page. Both extremes are almost always a measurement fault.
A 100% bounce rate means no session on that page qualified as engaged. On a page with a handful of sessions that is ordinary noise.
On a page with real traffic it usually means the tag is firing once and then not firing again, or the page is a destination people reach and act on outside the browser, like a phone number on a contact card.
A 0% bounce rate is stranger and worse. It generally means something is firing an extra event on every visit, so every session qualifies as engaged automatically.
A scroll trigger set to fire immediately does it. So does a tag installed twice, which also inflates every other number you have.
Either way the number is telling you about your measurement, and that is worth knowing first. Fix the tracking, wait a week, and read the page again.
Does Bounce Rate Affect Your Rankings?
No, not directly. It is not a lever on search engine optimization (SEO), and the reason is arithmetic rather than policy.
The figure is computed inside your own analytics property, from tracking you installed, against a threshold you can change in a settings panel. A number a site owner can move by editing a field is not a number a search engine can lean on.
Google's own SEO guidance, for reading Search Console and Analytics together, builds its recommended dashboard on five metrics. Three come from Analytics: sessions, engagement rate, and returning users.
Engagement rate is bounce rate inverted. It is there to help you understand how people find and experience your site, not because a search engine reads it.
The indirect story is real, though, and worth separating from the myth.
A page people leave immediately because it did not deliver what the result promised has a content problem. That problem is what search systems are built to notice.
The bounce rate is how you found out, not the thing being judged.
Where to Find It, and What to Break It Down By
In Google Analytics 4, bounce rate is not on the default reports and has to be added.
Open Reports, then Engagement, then Pages and screens. Use Customize report, pick the metrics, and add Bounce rate to the list.
You need Editor or Administrator access to save that change. In Explore you can add it as a metric to any free-form table from the start.
If your dashboard shows engagement rate and you cannot be bothered, subtract it from 100. It is the same number.
Then break it down, because the total is the least useful view of it.
- By page. Always first. This is where the metric has its information, and where a sitewide average destroys it.
- By traffic source. The same page reached from a newsletter, an ad and an organic result is three different audiences with three different expectations.
- By device. A gap between phone and desktop on one page is a layout or speed problem with a specific place to look.
- By landing page and query together. When a page bounces hard on one search and not another, the page is answering one of those searches and not the other.
Two rules make these breakdowns readable. Compare like periods, because traffic mix moves by weekday and by campaign. And ignore any segment too small to have stabilized: a 100% bounce rate on nine sessions is not a finding.
The Number Is a Question, Not a Score
Read the number as a shortlist of pages to look at, and nothing more.
It tells you how often a visit went no further. The page's job decides whether that matters, which is why the insurance explainer bouncing at 71% and the quote page bouncing at 19% were both working.
So stop managing the site-level figure. It averages together pages built for different jobs and comes out describing none of them.
Read it page by page instead, against what each page was for.
Where the number fits the job, leave it alone, however high it looks next to a published range. Where it does not fit, you have found something worth a morning: a broken page, a promise the page does not keep, or a step people cannot get through.
That is the whole use of it. A number that points at the pages worth looking at, and says nothing at all about the ones it does not.