What Is A/B Testing, and When Can You Trust the Result?
Run a split test that settles the question: what to measure, how many visitors you need, and what your significance number does and does not claim.


/ On this page12 sections
A/B testing settles an argument about your product with your own visitors rather than with opinion. You build two versions of the same thing, show them at the same time to people split at random, and let one metric you named in advance decide.
The mechanics take an afternoon. What decides whether the answer is worth acting on is quieter: what you measure, how many people you need before the number means anything, and what your significance figure is claiming.
Get those three wrong and you still get a winner, with a green tick beside the wrong version.
What A/B Testing Is
An A/B test compares two versions of one thing, live at the same time, with each visitor assigned to a version at random and a single named metric deciding which one wins.
Version A is usually what you already have, which is why it is called the control. Version B is the change you want to make.
Everything else about the two experiences is meant to be identical.
Three properties do the work, and every one of them is easy to lose by accident:
- Assignment is random. Not by device, not by day, not by which visitors happened to arrive first. Random assignment is what makes the two groups comparable on everything you did not think to control for, including things you could never measure.
- Both versions run at the same time. A test run in sequence, B this week against A last week, is not a test. Any difference between the weeks belongs to the calendar as much as to your change.
- One metric decides, and it is fixed in advance. The result cannot be chosen after the fact if the definition of winning already exists.
That last property is the one people give away most cheaply. It is also the cheapest to keep.
It Is Called Split Testing Too
Split testing is the same thing under a different name, and you will see both used interchangeably.
Where the two words drift apart is in a split URL test, which serves two separate pages at two separate addresses rather than altering one page in the browser. That is a distinction about implementation, not about the method.
Why Bother Testing Instead of Shipping the Change
Shipping the change tells you what happened next. A test tells you what your change caused.
Those are not the same claim, and only one of them survives a seasonal dip, a competitor's campaign, or a payday.
Say your signups fall in the two weeks after a redesign.
Without a control group you cannot separate the redesign from everything else that moved in those two weeks.
The honest answer is that you do not know. The tempting answer is that you do.
A control group is the entire difference. It is the same two weeks, the same market, the same traffic mix, running the old version.
That is what you are buying, and it is the only thing you are buying. Everything else people claim for testing follows from it or is not true.
- It answers a causal question. Nothing else in your analytics stack does.
- It makes a change reversible before it is permanent. You find out on a fraction of your traffic instead of all of it.
- It settles disagreements without seniority. The metric was agreed in advance, so nobody has to win the argument in the room.
What it does not do is tell you why.
A test can tell you the shorter form won. It will never tell you which field people hated.
The Test Families, and Which One You Want
There are five shapes worth knowing, and they differ mainly in what they cost you in traffic. Every extra version you add is another group that has to be filled before you can read the result.
Start from the question you are asking, not from the feature list of your tool.
| The test | What it compares | Use it when | What it costs |
|---|---|---|---|
| Classic A/B | One control against one variant | You have a single change and a single question | The least traffic of any option |
| A/B/n | One control against several variants | You have three or four credible ideas and no way to rank them | Traffic multiplied by the number of arms |
| Split URL | Two separate pages at two separate addresses | The change is too structural to make in the browser | Same as classic, plus redirect handling |
| Multivariate | Combinations of several elements at once | You want to know how elements interact, not which one wins | Every combination is its own arm, so the count climbs fast |
| A/A | The control against an identical copy of itself | You are commissioning a setup and want to know if it lies | A full test's worth of traffic, spent on plumbing |
Classic A/B is the default, and the published research is no different.
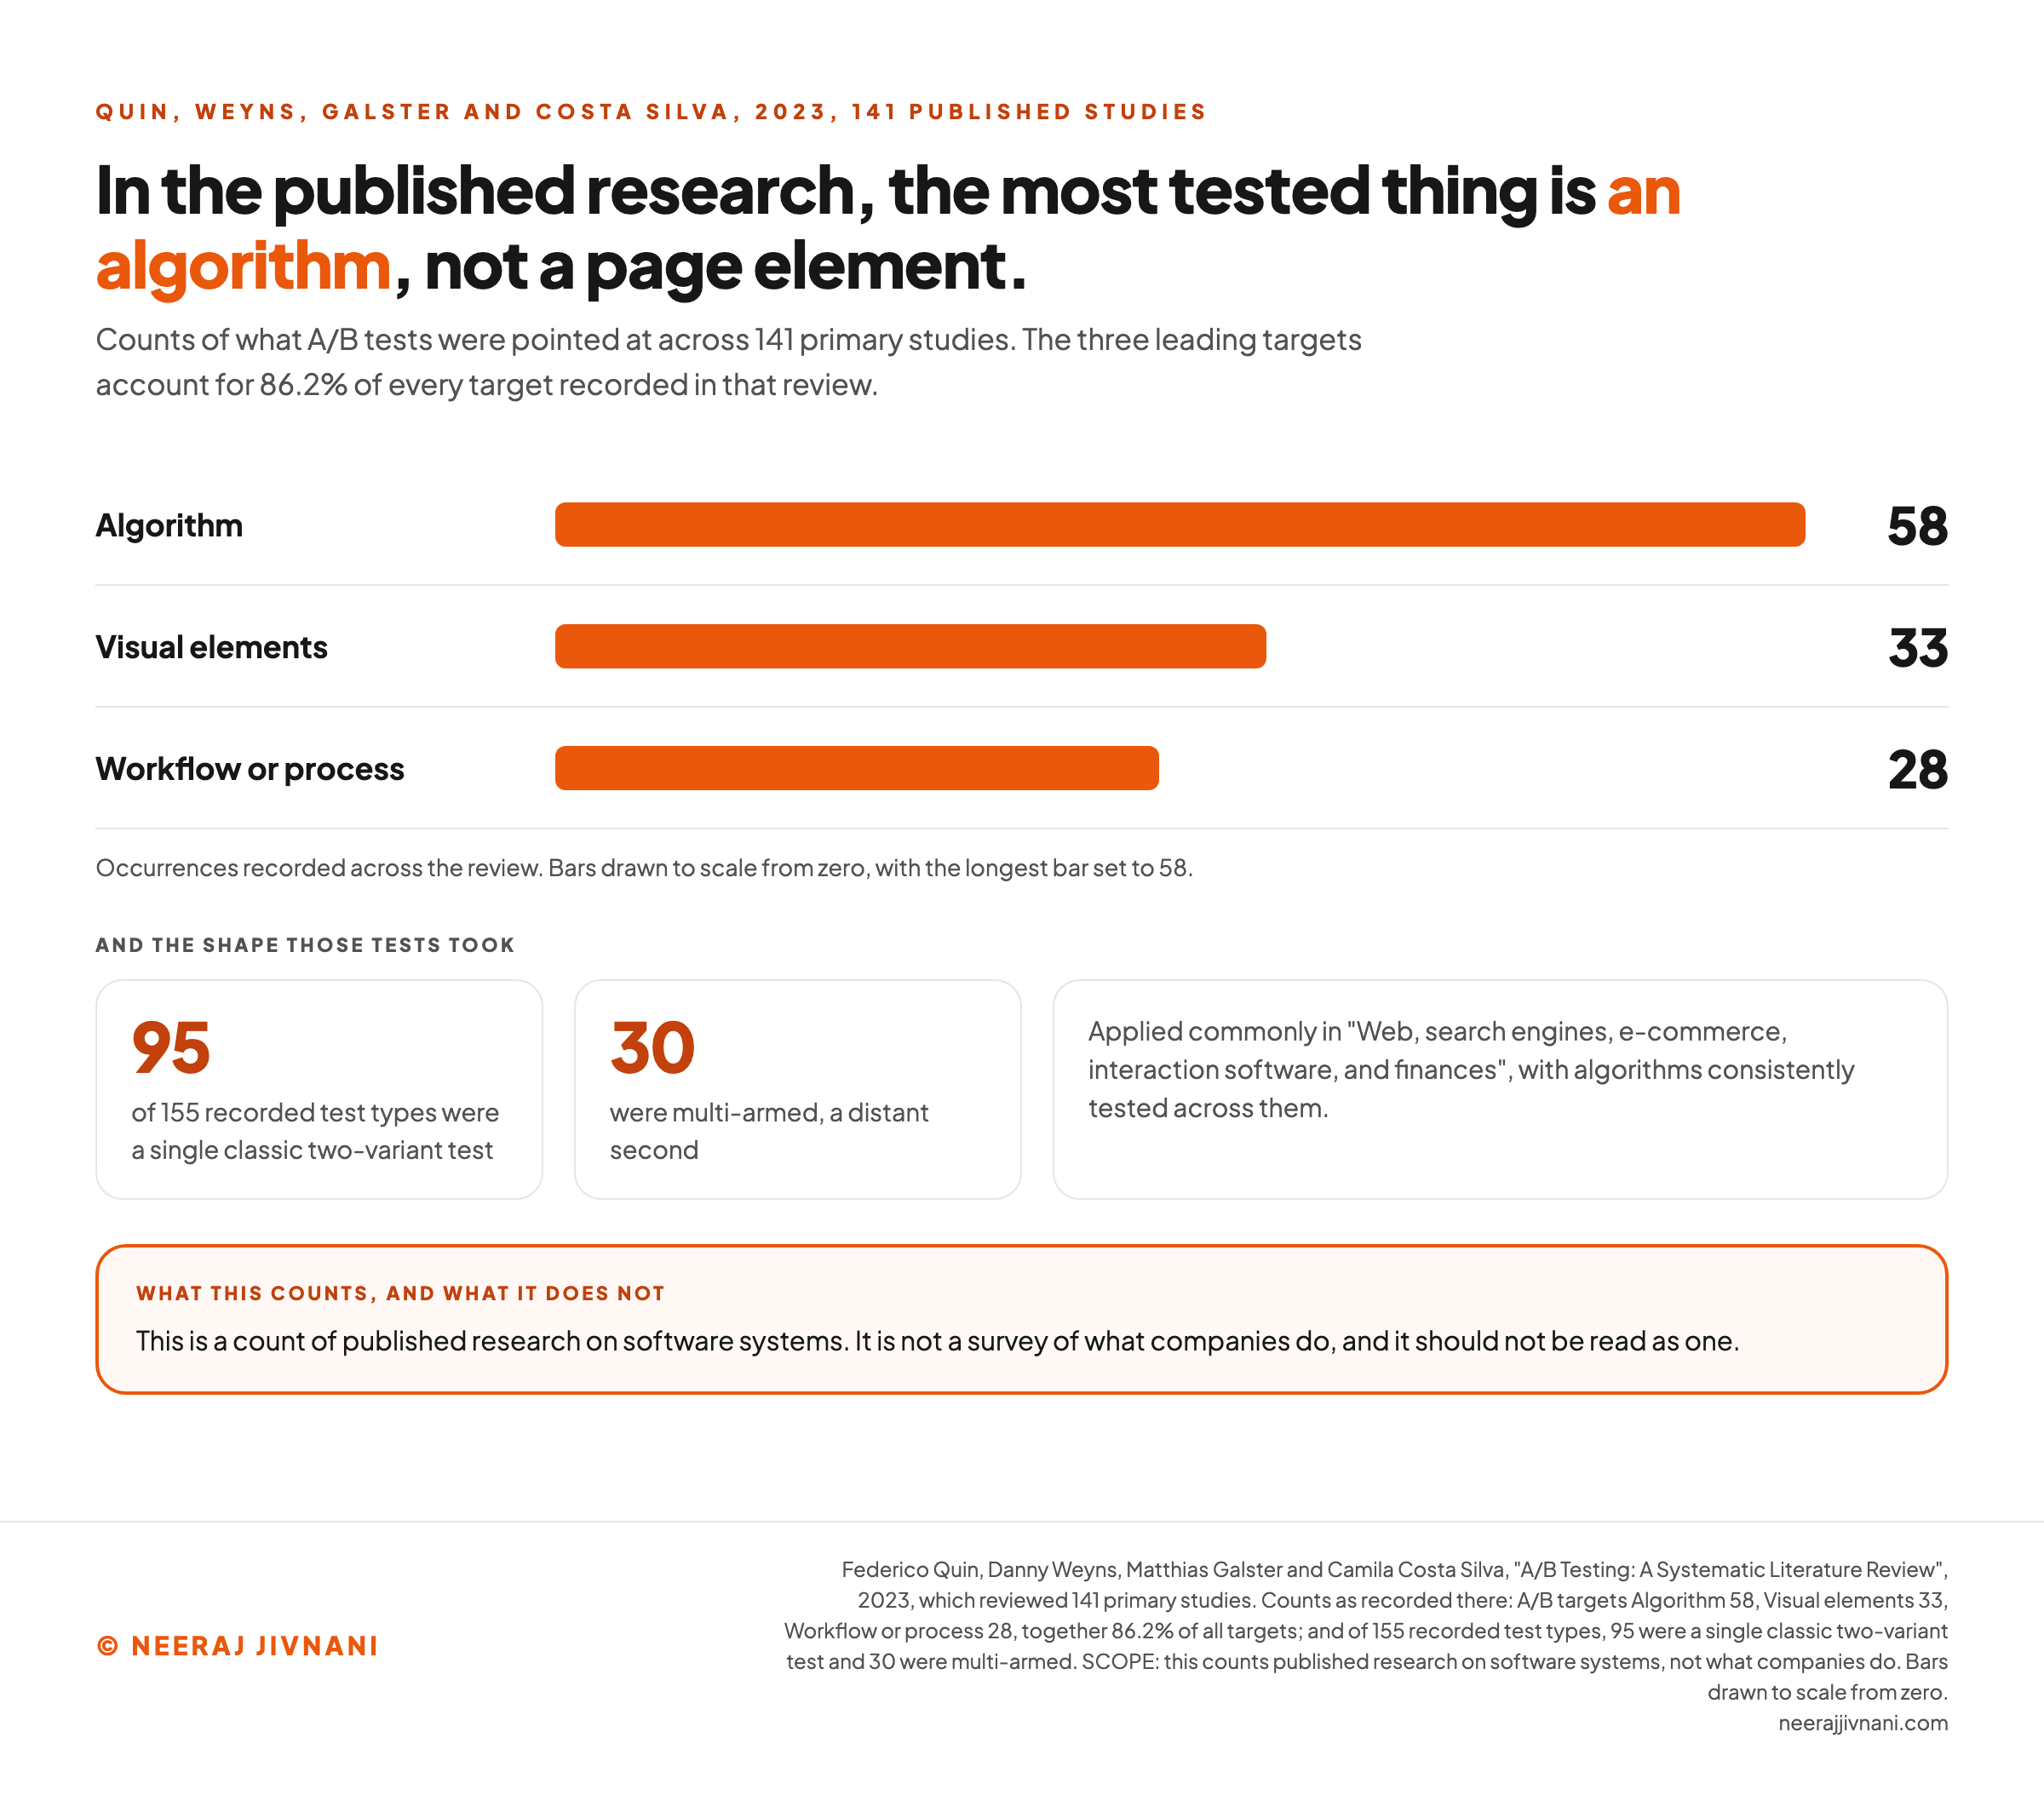
Of the 155 recorded test types, 95 were a single classic two-variant test, in Quin, Weyns, Galster and Costa Silva's 2023 systematic review of 141 published studies. Multi-armed tests were a distant second at 30.
What a Multivariate Test Answers
A multivariate test varies several elements at once and reads every combination, so three elements with two versions each is eight arms rather than two.
It answers a different question. It tells you how elements interact, which a series of A/B tests cannot, at the price of needing enough traffic to fill all eight cells.
If you are asking which headline wins, an A/B test is the right instrument and a multivariate test is an expensive way to get the same answer later.
An A/A Test Checks the Instrument, Not the Idea
An A/A test shows two identical versions and should usually find nothing. It is the cleanest way to catch a setup that manufactures differences out of noise.
Run one when you are new to a platform, or after a change to how visitors are assigned. Skip it once you trust the plumbing, because it consumes real traffic to confirm something you only need to confirm once.
Multi-Armed Bandits Do Something Else Entirely
A bandit shifts traffic toward whichever version is doing better while the test is still running.
That is useful when the cost of showing the worse version is high and the window is short. A holiday promotion is the obvious case.
It is the wrong tool when you want a clean estimate of how much better B is. A fixed split exists precisely to stop the allocation moving.
A holdout answers the question that comes after. It is a slice of traffic kept on the old experience for weeks once you ship, so you can see whether the win survives.
What Is Worth Testing
Two categories are worth testing: the things a visitor has to get past to convert, and the logic that decides what they are shown.
Start with the first. On a page, that means:
- The headline and the offer wording, which is the only part many visitors read.
- The call to action, its wording and its position, not its color.
- Form length, because every field is a fresh chance to abandon.
- Layout and what sits above the fold, particularly on a phone.
- How price and shipping are presented, which is different from what they are.
The Second Category Is the One People Forget
Page elements are real ground, and they are not the whole of it.
An algorithm was the most common target of an A/B test, at 58 occurrences across the 141 studies in Quin, Weyns, Galster and Costa Silva's 2023 systematic review. Visual elements followed at 33 and workflow or process changes at 28.
Those three together accounted for 86.2% of every target recorded.
That is a count of published research on software systems, not a survey of what companies do.
In that record the tests that get run most often change what the system decides rather than what the page says. Search ranking, feed ordering and recommendations are the ordinary examples.
If your site sorts, filters or personalizes anything, that logic is testable, and it is usually the biggest untested surface you have.
Use this chart — embed code and citation
<a href="https://neerajjivnani.com/blog/ab-testing/"><img src="https://neerajjivnani.com/infographics/ab-testing/what-the-review-counted.png" alt="Horizontal bars drawn to scale from zero showing what A/B tests were pointed at across the 141 published studies in Quin, Weyns, Galster and Costa Silva 2023: algorithm 58 occurrences, visual elements 33 and workflow or process 28, together 86.2% of every target recorded; beneath them, that 95 of 155 recorded test types were a single classic two-variant test and 30 were multi-armed, that the domains were web, search engines, e-commerce, interaction software and finances, and a highlighted caveat that this counts published research on software systems rather than surveying what companies do." width="1200"></a>
<p>Chart: <a href="https://neerajjivnani.com/blog/ab-testing/">Neeraj Jivnani</a></p>Neeraj Jivnani, "What Is A/B Testing, and When Can You Trust the Result?", neerajjivnani.com, https://neerajjivnani.com/blog/ab-testing/Free to republish with a link back to this page.
How to Run One That Can Settle Something
Whether a test can settle anything comes down to four decisions, and all four are made before a single visitor is assigned.
None of them looks like work, which is why they get skipped. The build and the launch are the easy part.
Decide the one metric. Not a dashboard, one number. If you cannot say which single measure would make you adopt the variant, you have not defined a test yet, you have defined a comparison.
Pick the metric closest to the behavior you are changing that still has the volume to move.
Checkout completions if you changed the checkout. Add to cart if purchases are too rare to resolve.
Decide what would make you stop. Write down the result that would tell you the idea was wrong, and the result that would tell you it was right, before you look at anything.
This is the whole of what a hypothesis is for. Write down only the outcome you want and every result can be read as encouraging.
Decide the size and the duration. Both come out of arithmetic, and both are fixed in advance rather than discovered by watching.
Decide who is in the test. New visitors only, or everyone. Logged in, or all traffic. A test that quietly includes your own team, your uptime monitors and a scraper is measuring something other than customers.
Only after those four does anything get built, launched or read.
Where the Idea Comes From
A test is a poor instrument for finding out what is wrong. It is an excellent one for deciding between two answers you already have.
So the work before the test is the work that produces candidates: session recordings, funnel drop-offs, support tickets, and asking people on the page they abandon. If you are testing to discover the problem, you will be running tests for a long time.
And one test settles almost nothing on its own. What compounds is the log: the record of what you tried, what you predicted, and what happened, which is the only thing that stops the same idea being retested two years later.
How Big, and How Long
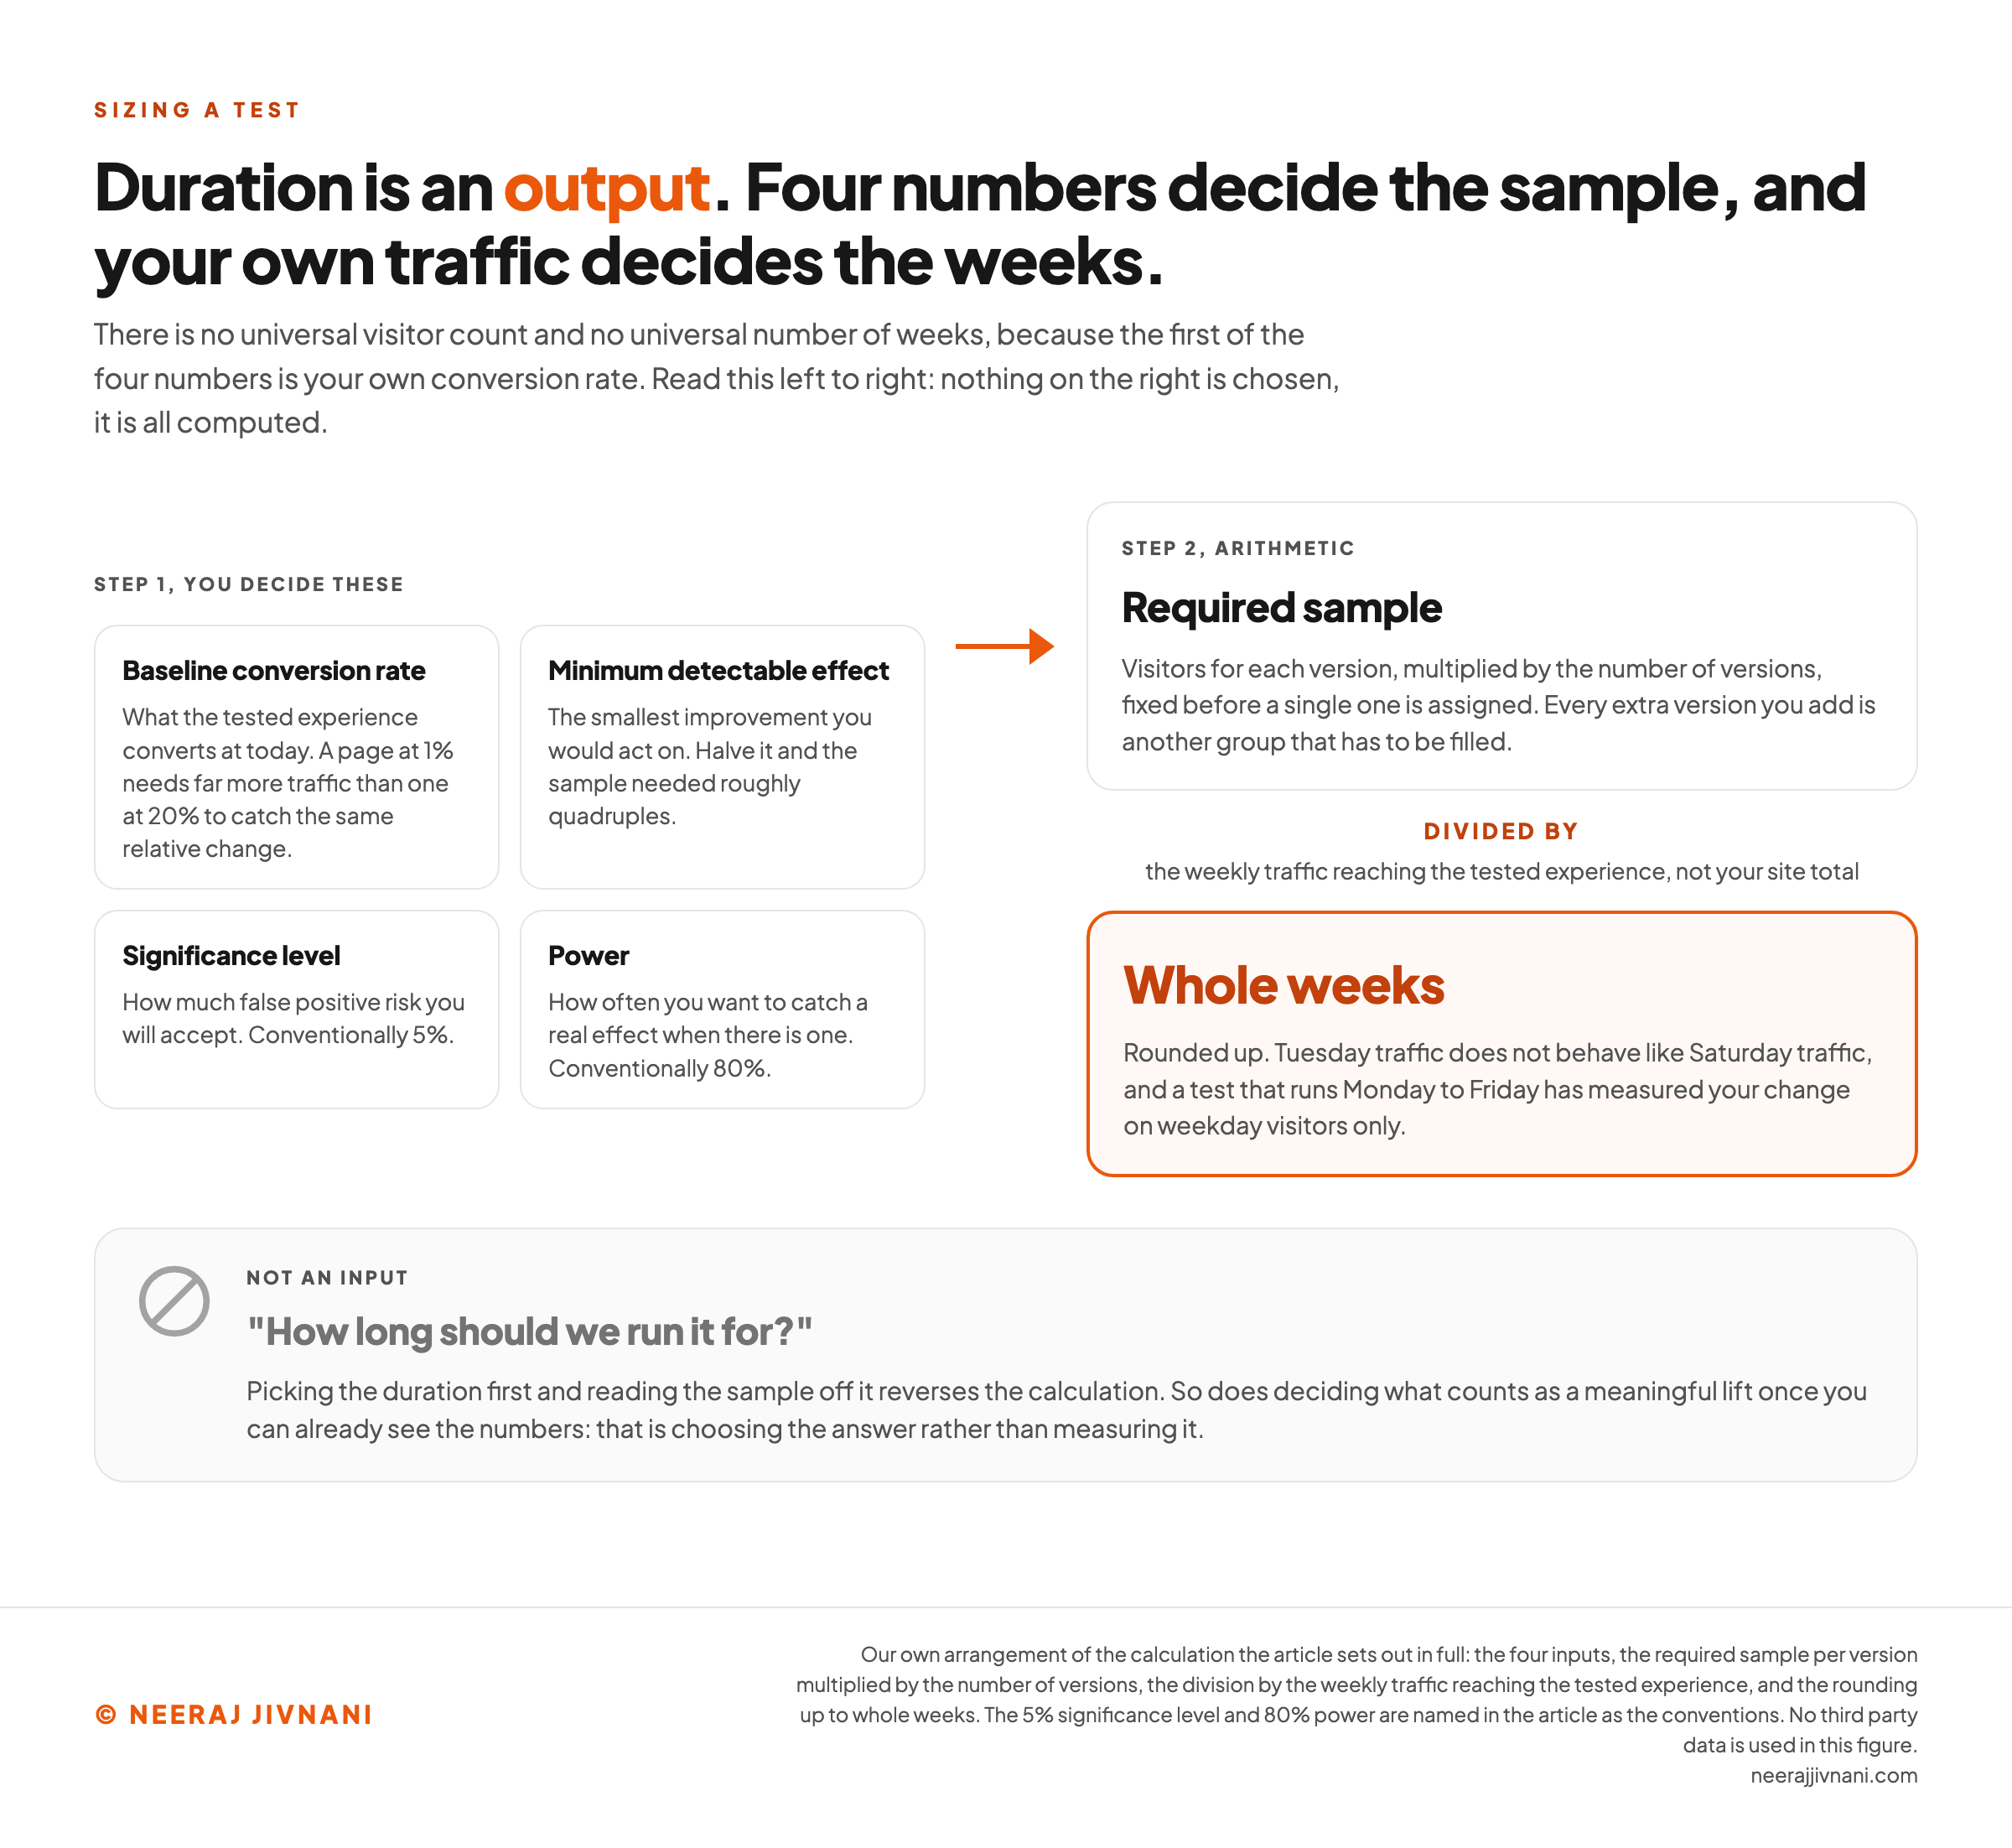
Your required sample size comes out of four numbers, and it is a count for each version. Your duration is that sample multiplied by the number of versions, divided by the traffic reaching the tested experience.
There is no universal visitor count and no universal number of weeks, because the first of those four numbers is your own conversion rate.
Here is what each input does, and changing any one of them moves the answer a long way:
- Your baseline conversion rate. A page converting at 1% needs far more traffic than one converting at 20% to detect the same relative change.
- The minimum detectable effect. The smallest improvement you would act on. Halve it and the sample needed roughly quadruples.
- Your significance level. How much false positive risk you will accept, conventionally 5%.
- Your power. How often you want to catch a real effect when there is one, conventionally 80%.
Duration is then the output, not an input, and it is rounded up to whole weeks.
Whole weeks matter for a reason that has nothing to do with the arithmetic. Tuesday traffic does not behave like Saturday traffic, and a test that runs Monday to Friday has measured your change on weekday visitors only.
Refuse to Set the Effect Size Afterward
If you decide what counts as a meaningful lift once you can already see the numbers, you have chosen the answer rather than measured it.
Write the minimum detectable effect down first. It is the number that makes the whole calculation honest.
Four numbers in, the weeks out
There is no field for how long to run it, and that is the point. Put in the four numbers the calculation actually takes and the duration falls out of them at the bottom.
1. The two numbers that are yours to decide
What the tested experience converts at today, before you change anything.
A 10% relative lift on a 2% baseline means 2.2%, not 12%. Write it down before you can see any data.
2. The two conventions, and how many versions are live
Significance level
Power
Versions live at once
Not your site total. Only the people who actually see the page or flow you are testing.
Fill in the first two and the sample appears here. Add the third and it becomes weeks. Nothing here will tell you how long a test should run in general, because that number does not exist.
Two consequences follow from that arithmetic, and both are unwelcome.
The first is that a small site often cannot test small changes at all. If the arithmetic says nine months, the test is not slow, it is unavailable, and running it anyway buys you a number you cannot use.
The second is that the minimum detectable effect is a business decision wearing a statistical costume. Deciding you would not bother acting on anything under a certain lift is what makes the test affordable.
Use this chart — embed code and citation
<a href="https://neerajjivnani.com/blog/ab-testing/"><img src="https://neerajjivnani.com/infographics/ab-testing/duration-is-an-output.png" alt="Left to right diagram of how a test is sized, showing four inputs you decide, the baseline conversion rate, the minimum detectable effect, the significance level conventionally at 5% and the power conventionally at 80%, feeding by arrow into a required sample of visitors for each version of the page, which is multiplied by the number of versions and then divided by the traffic that reaches the tested experience each week and rounded up to whole weeks; a panel below, marked as not an input and crossed out, holds the question how long should we run it for, with the note that picking the duration first reverses the calculation." width="1200"></a>
<p>Chart: <a href="https://neerajjivnani.com/blog/ab-testing/">Neeraj Jivnani</a></p>Neeraj Jivnani, "What Is A/B Testing, and When Can You Trust the Result?", neerajjivnani.com, https://neerajjivnani.com/blog/ab-testing/Free to republish with a link back to this page.
Reading the Result Honestly
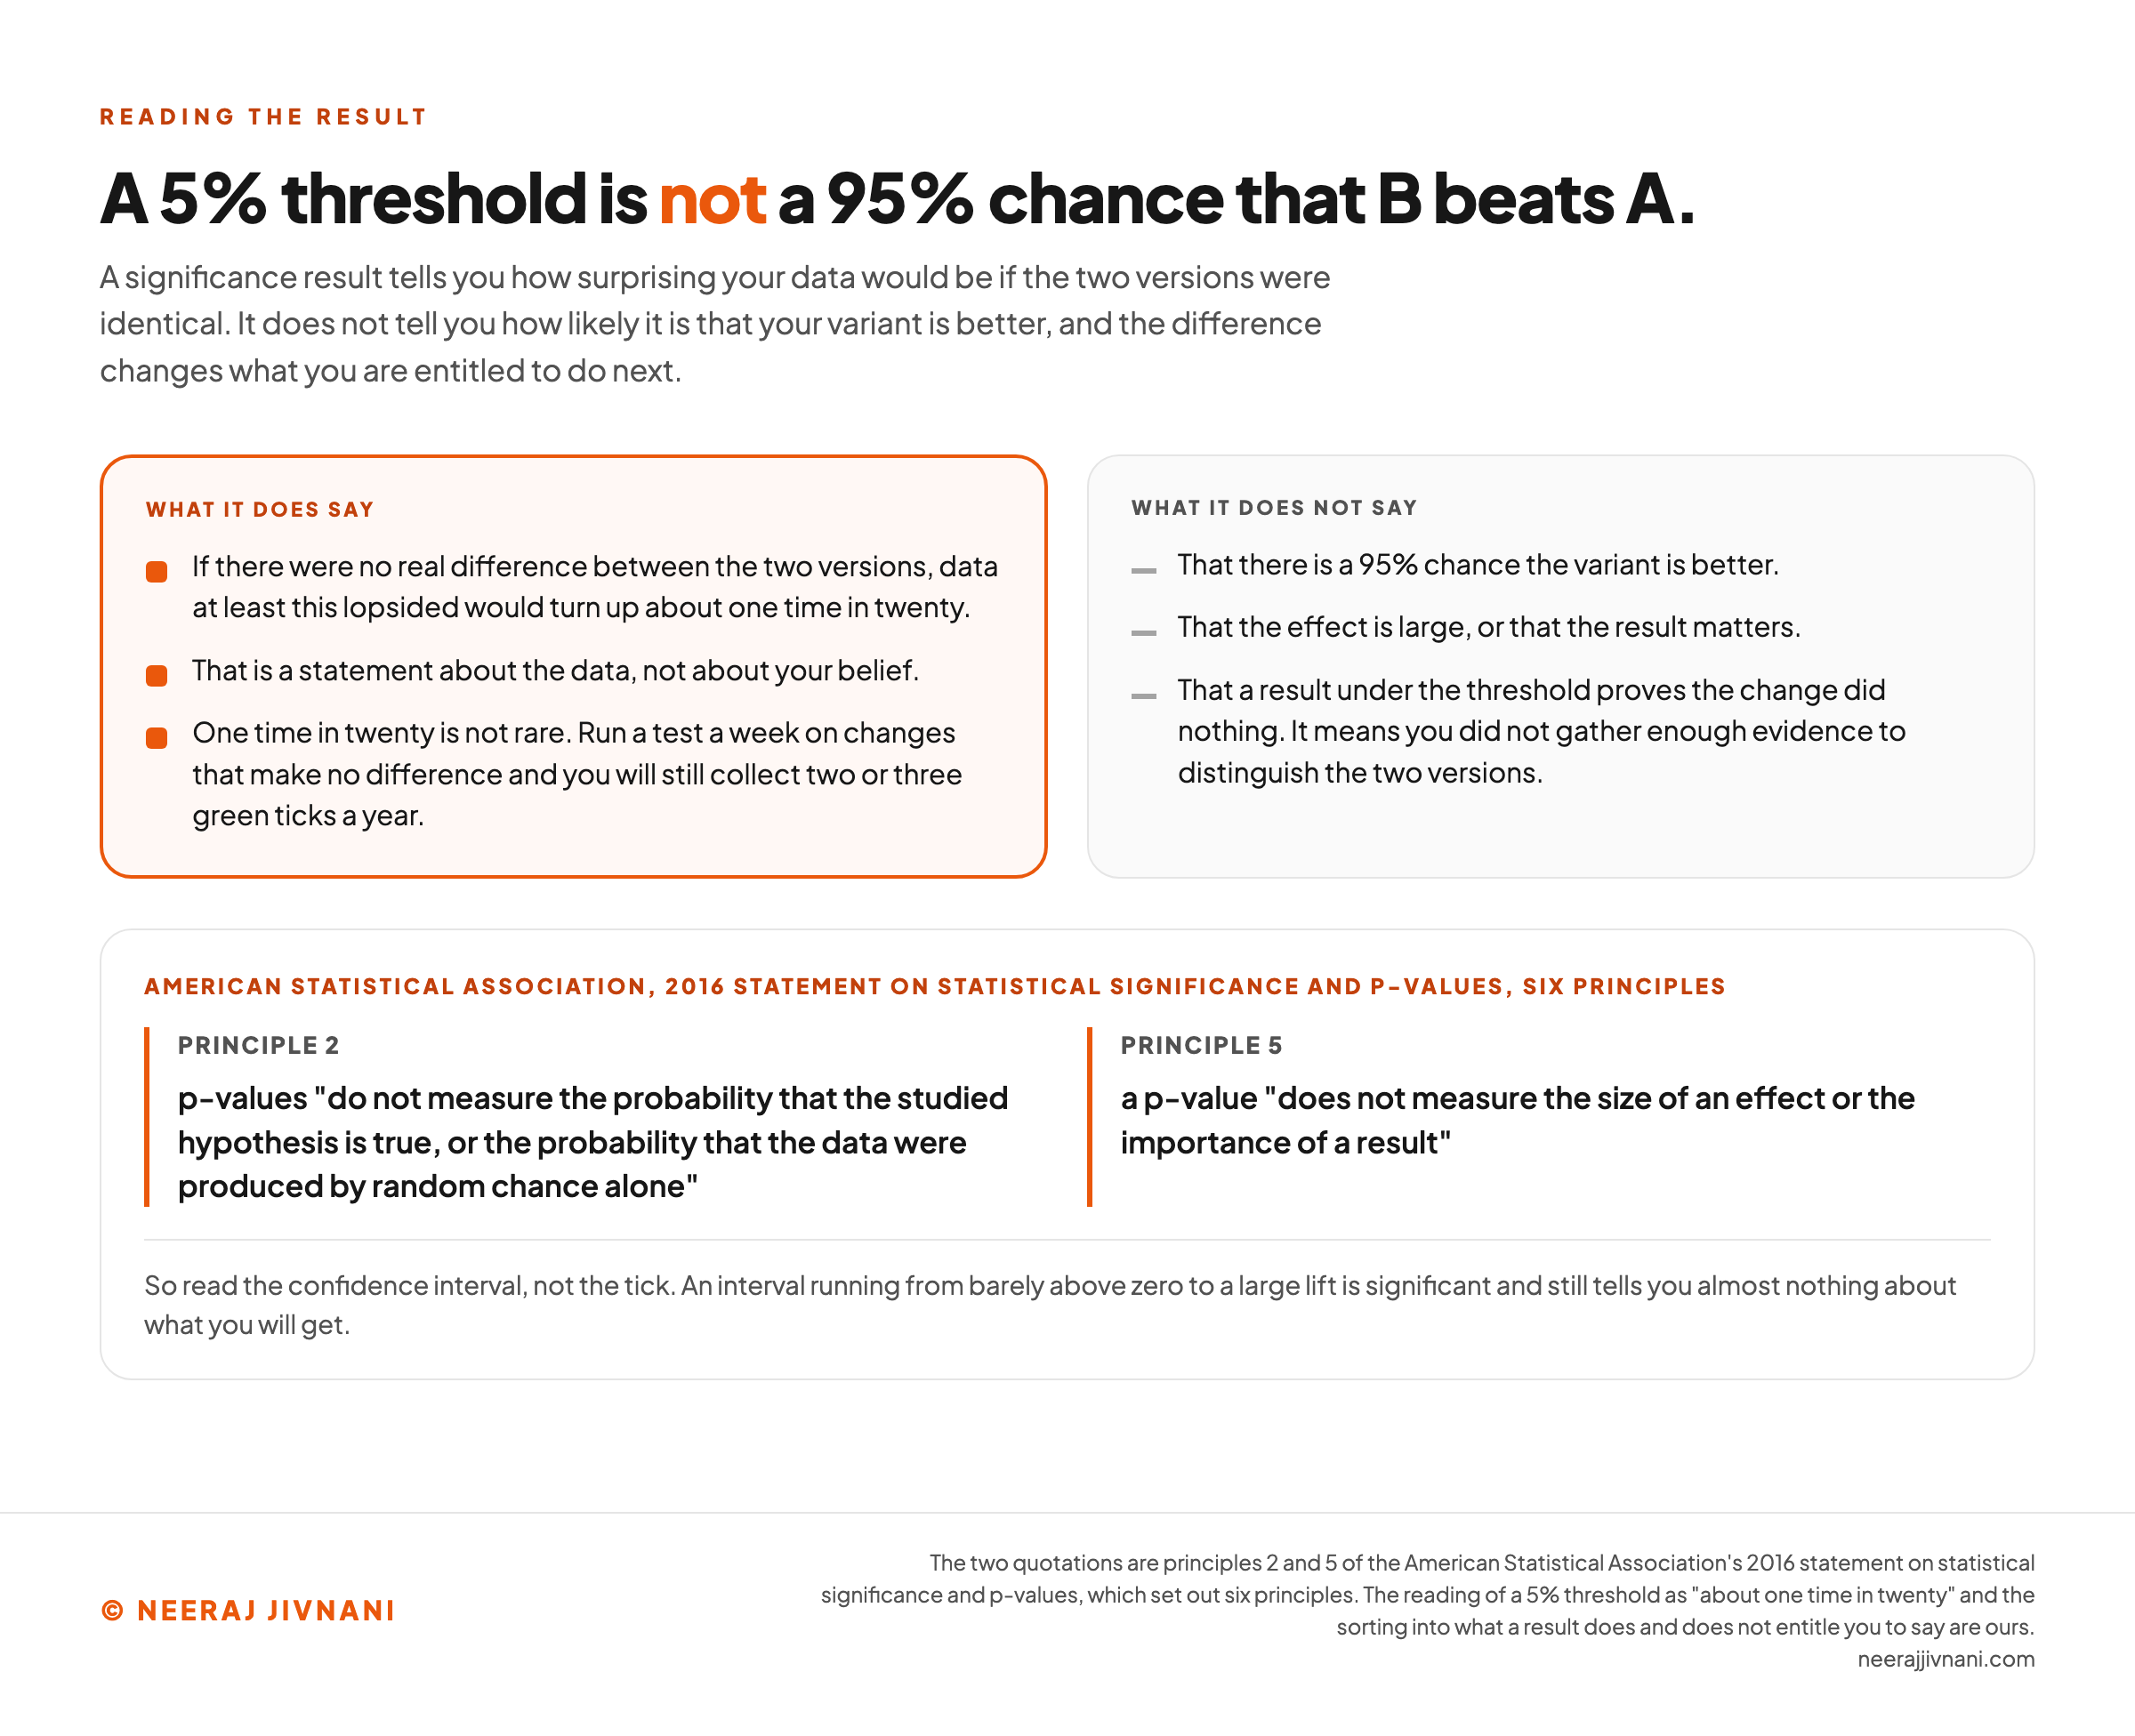
A significance result tells you how surprising your data would be if the two versions were identical. It does not tell you how likely it is that your variant is better.
That pedantic-sounding distinction changes what you are entitled to do next.
P-values "do not measure the probability that the studied hypothesis is true, or the probability that the data were produced by random chance alone". That is principle 2 of the American Statistical Association's 2016 statement.
So a result at the conventional 5% threshold is not a 95% chance that B beats A. It means that if there were no real difference, data at least this lopsided would turn up about one time in twenty.
One time in twenty is not rare. Run a test a week on changes that make no difference and you will still collect two or three green ticks a year.
Not Significant Does Not Mean No Difference
A test that fails to reach the threshold has told you one thing: you did not gather enough evidence to distinguish the two versions.
That is compatible with the variant being slightly better, slightly worse, or identical. Treating it as proof that the change did nothing is the most common misreading of a null result, and it quietly kills good ideas.
The honest report is that the test was inconclusive at the size you ran it.
A Winning Result Says Nothing About Size
Significance and size are separate questions. A p-value "does not measure the size of an effect or the importance of a result", which is principle 5 of the American Statistical Association's 2016 statement.
With enough traffic a change worth almost nothing becomes significant, and that is a property of your sample rather than a property of your idea.
Read the confidence interval, not the tick. An interval running from barely above zero to a large lift is significant and still tells you almost nothing about what you will get, while a narrow interval around a smaller number supports a decision.
If Your Tool Reports a Probability Instead
Some platforms use a Bayesian engine and report a probability that B beats A, or an expected loss if you pick wrong.
That number answers a different question from a p-value, and it is closer to the question you had in mind when you opened the results screen.
It also depends on the assumptions the tool started with. Two platforms can read the same data and print different probabilities.
Either engine is defensible. What is not defensible is reading one as though it were the other.
Use this chart — embed code and citation
<a href="https://neerajjivnani.com/blog/ab-testing/"><img src="https://neerajjivnani.com/infographics/ab-testing/what-the-threshold-says.png" alt="Two panels sorting what a result at the 5% significance threshold does and does not entitle you to say: on the left, that data at least this lopsided would turn up about one time in twenty if there were no real difference, that this is a statement about the data rather than about your belief, and that running a test a week on changes that make no difference still collects two or three green ticks a year; on the right, that it is not a 95% chance the variant is better, not a measure of how large or important the effect is, and not proof that a change did nothing; below them, principles 2 and 5 of the American Statistical Association 2016 statement quoted in full, and the instruction to read the confidence interval rather than the tick." width="1200"></a>
<p>Chart: <a href="https://neerajjivnani.com/blog/ab-testing/">Neeraj Jivnani</a></p>Neeraj Jivnani, "What Is A/B Testing, and When Can You Trust the Result?", neerajjivnani.com, https://neerajjivnani.com/blog/ab-testing/Free to republish with a link back to this page.
Where Tests Go Wrong
Five failures account for most bad test results. Two of them are things you decide, two are things you have to look for, and one is arithmetic you can do in advance.
Each leaves the tool reporting a clean number, and each is checkable before you act on a result.
Stopping the Moment It Looks Significant
Checking a running test and stopping when it first crosses the threshold is the most expensive habit in this subject, because it feels like diligence.
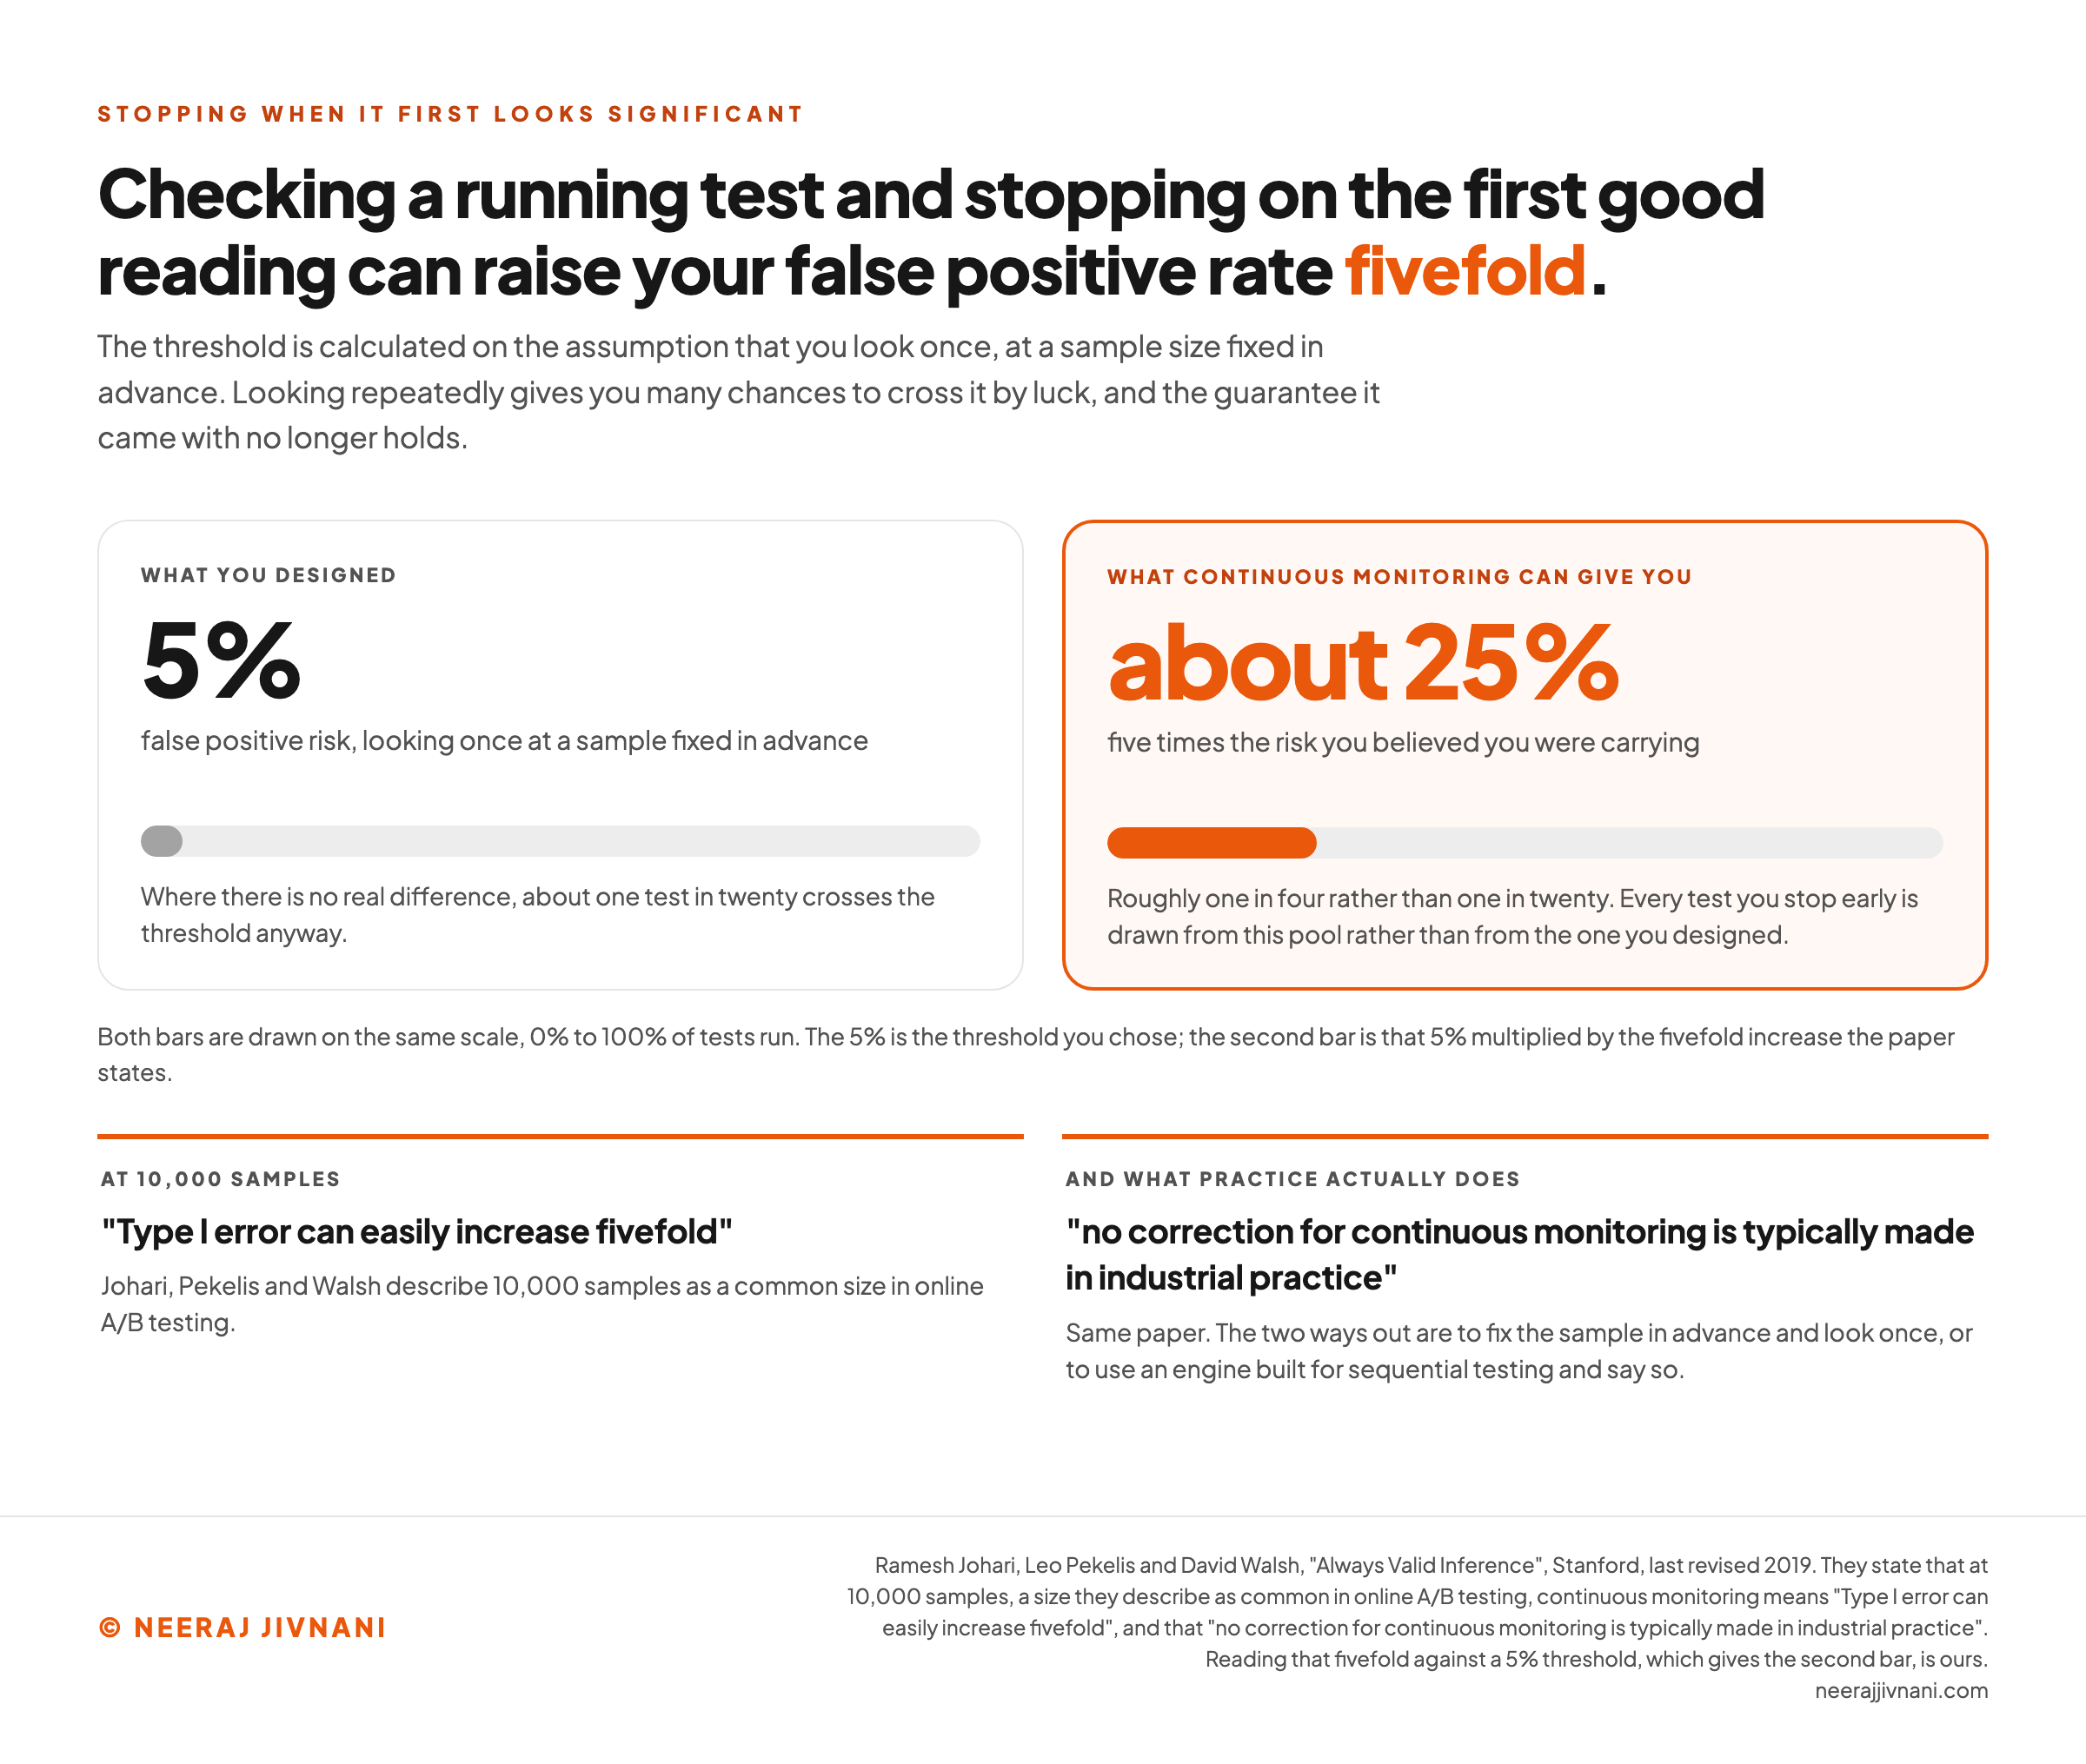
The threshold is calculated on the assumption that you look once, at a sample size fixed in advance. Looking repeatedly and stopping on the first favorable reading gives you many chances to cross it by luck, and the guarantee it came with no longer holds.
Even at a sample of 10,000, under continuous monitoring "Type I error can easily increase fivefold". Johari, Pekelis and Walsh state that in their 2019 paper, and they describe that size as common in online A/B testing.
They also record that "no correction for continuous monitoring is typically made in industrial practice".
A threshold you believed carried a 5% false positive risk can be running at something nearer 25%, and every test you stop early is drawn from that pool rather than the one you designed.
There are two ways out.
Fix the sample size in advance and look once. Or use a platform whose engine is built for sequential testing and says so, because that machinery is what makes continuous monitoring legitimate.
Running It Underpowered
A test with too few visitors is not a smaller test. It is a test that will usually miss a real effect and, when it does find one, will overstate its size.
That combination is worse than not testing, because it produces confident numbers. Work out the sample first and decide whether you can afford it.
Sample Ratio Mismatch
If you split traffic evenly and one version received noticeably more visitors than the other, something in the assignment is broken.
The mismatch itself is rarely the problem. It is the symptom that says whatever caused it may also have sorted visitors non-randomly, and once that is possible the comparison means nothing.
Check the split before you read the result, every time.
Novelty and the Return to Normal
Regular visitors react to change because it is different, not because it is better. A new layout can win for two weeks and settle back to where it started.
Where you have returning users, look at how the effect moves over the test rather than at the total, and treat a first week spike with suspicion.
Finding the Winner in a Subgroup
A test that fails overall will almost always contain some segment where the variant won. Mobile users in one country on a Tuesday is a finding about noise.
Segments are legitimate when you named them before the test and sized the test to resolve them. Found afterward, they are a way of asking the data enough questions that one of them says yes.
Use this chart — embed code and citation
<a href="https://neerajjivnani.com/blog/ab-testing/"><img src="https://neerajjivnani.com/infographics/ab-testing/looking-more-than-once.png" alt="Two bars on the same 0% to 100% scale comparing the false positive risk you design a test with against the risk continuous monitoring can leave you carrying: 5% on the left, labeled as looking once at a sample size fixed in advance, and about 25% on the right, labeled as five times the risk you believed you were carrying, roughly one test in four rather than one in twenty; underneath, two quotations from Johari, Pekelis and Walsh, that at 10,000 samples "Type I error can easily increase fivefold" and that "no correction for continuous monitoring is typically made in industrial practice", with a note that the fivefold is theirs and reading it against a 5% threshold is ours." width="1200"></a>
<p>Chart: <a href="https://neerajjivnani.com/blog/ab-testing/">Neeraj Jivnani</a></p>Neeraj Jivnani, "What Is A/B Testing, and When Can You Trust the Result?", neerajjivnani.com, https://neerajjivnani.com/blog/ab-testing/Free to republish with a link back to this page.
When Not to Run a Test at All
Testing is the right instrument for a genuine disagreement between two credible options. It is the wrong one more often than its popularity suggests.
Four situations call for something else:
- The arithmetic says you cannot. A low-traffic site chasing a small relative lift on a low baseline rate will find the required sample runs to years. Say so out loud before anyone waits for it.
- The change cannot be randomized. A price you have already published, an email that has already gone out, a policy that has to apply to everyone at once. There is no way to hold half your audience on the old version, so the comparison you would need never exists.
- The metric will not arrive in time. If the outcome you care about lands months after the visit, like a renewal or a refund, no affordable window will contain it. Pick a nearer measure you can defend as a stand-in, or decide without one.
- You would ship it regardless. If the accessibility fix goes live whatever the number says, running the test is theater with a traffic cost attached.
The first of those is the one people argue with, and the arithmetic does not care.
Where Tests Run, Beyond the Landing Page
Anyone with enough traffic and a decision to make can run an A/B test, and the surface is rarely only a landing page.
- Email. Subject lines, sender names and send times, usually as a small send to two slices of the list before the rest goes out.
- Paid advertising. Most ad platforms test creative natively by rotating variants and reallocating spend, which is a bandit rather than a fixed split.
- Product interfaces. Onboarding flows, empty states, notification wording, and whether a feature is behind a menu or on the screen.
- Pricing presentation. How a price is displayed, packaged and anchored.
- Ranking and recommendation logic. The search results, the feed order, the related items, all of which are decisions made by code that can be swapped.
In the published research the same pattern holds. Quin and colleagues' 2023 review found A/B testing commonly applied in "Web, search engines, e-commerce, interaction software, and finances", with algorithms consistently tested across them.
The reason it spread beyond marketing is not fashion. A team that can split its users and measure an outcome can settle an argument this way, and both of those are ordinary capabilities in software.
What a Testing Tool Has to Do
A testing platform has four jobs, and the difference between tools is how well each is done rather than how many features are listed.
- Assign visitors at random, and keep the assignment. A returning visitor must see the same version, or your two groups blur into each other.
- Deliver the variant without breaking the page. Speed and stability here are a real constraint, not a detail.
- Record the metric you named, not a proxy for it. If the tool cannot see your actual conversion, it cannot judge your test.
- Report an interval, and be clear about its engine. A tool that shows a winner without saying how confident it is, and on what basis, is not finished.
Judge a platform on those four before you look at anything else on the page.
Client-Side or Server-Side
A client-side test changes the page in the browser after it loads, which is why it can be set up without engineering and why a visitor sometimes sees the original flash before the variant appears.
A server-side test decides which version to build before the page is sent.
It costs engineering time, and it is the only option when the thing being tested is not on the page at all. A ranking algorithm and a pricing rule are the obvious cases.
Teams that test a lot tend to end up with both, and choose per test rather than once.
What an A/B Test Buys You
An A/B test answers exactly one question well: whether this change caused that difference.
It answers it when three things are true. Assignment is random, the metric was named first, and the sample was large enough to resolve the effect you cared about.
Everything difficult sits in those three conditions. Building a test is easy, and the discipline around it is the scarce part.
If you take one habit away, take the stopping rule. Decide the sample size and the result that would change your mind before the test starts, then look once.
That single change removes the most common way a test comes back confident, well-presented and wrong.