Click-Through Rate: The Formula, and How to Read the Number You Get
Clicks divided by impressions is the easy part. See what each platform counts, why the number moves without your copy changing, and what good looks like.


/ On this page9 sections
Click-through rate (CTR) is clicks divided by impressions. Show something 1,000 times, collect 20 clicks, and that is 2%.
The sum is never the problem. You counted neither half of it, and the platform that did the counting treats an impression differently in a search result, in an inbox and in a feed.
So the same three letters name four measurements, and your number moves for reasons that are not your copy.
What Click-Through Rate Measures
Click-through rate is the share of the times something was shown that somebody clicked it. It is written as a percentage, and that percentage sign is the whole answer to what CTR% means.
The something can be a search ad, an organic result, a link in an email, a video thumbnail or a banner. The formula does not change.
What it tells you is narrow and useful.
It says whether the thing people saw was worth acting on, at the moment they saw it, in the place they saw it. It says nothing about what happened after the click.
The Arithmetic, on Stated Inputs
Divide clicks by impressions, then multiply by 100.
Run it on 50 clicks against 1,000 impressions and the answer is 5.0%, which is the worked example in Wall Street Prep's guide, updated in December 2023.
Now do the same sum on an email.
If your 1,000 is a list of delivered inboxes rather than a count of ad appearances, the answer is still 5.0% and it is not the same measurement.
One denominator is a set of people who agreed to hear from you. The other is a count of auction wins.
Compare the two anyway and you will worry about a healthy number, or relax about a poor one.
The Same Word, Four Different Denominators
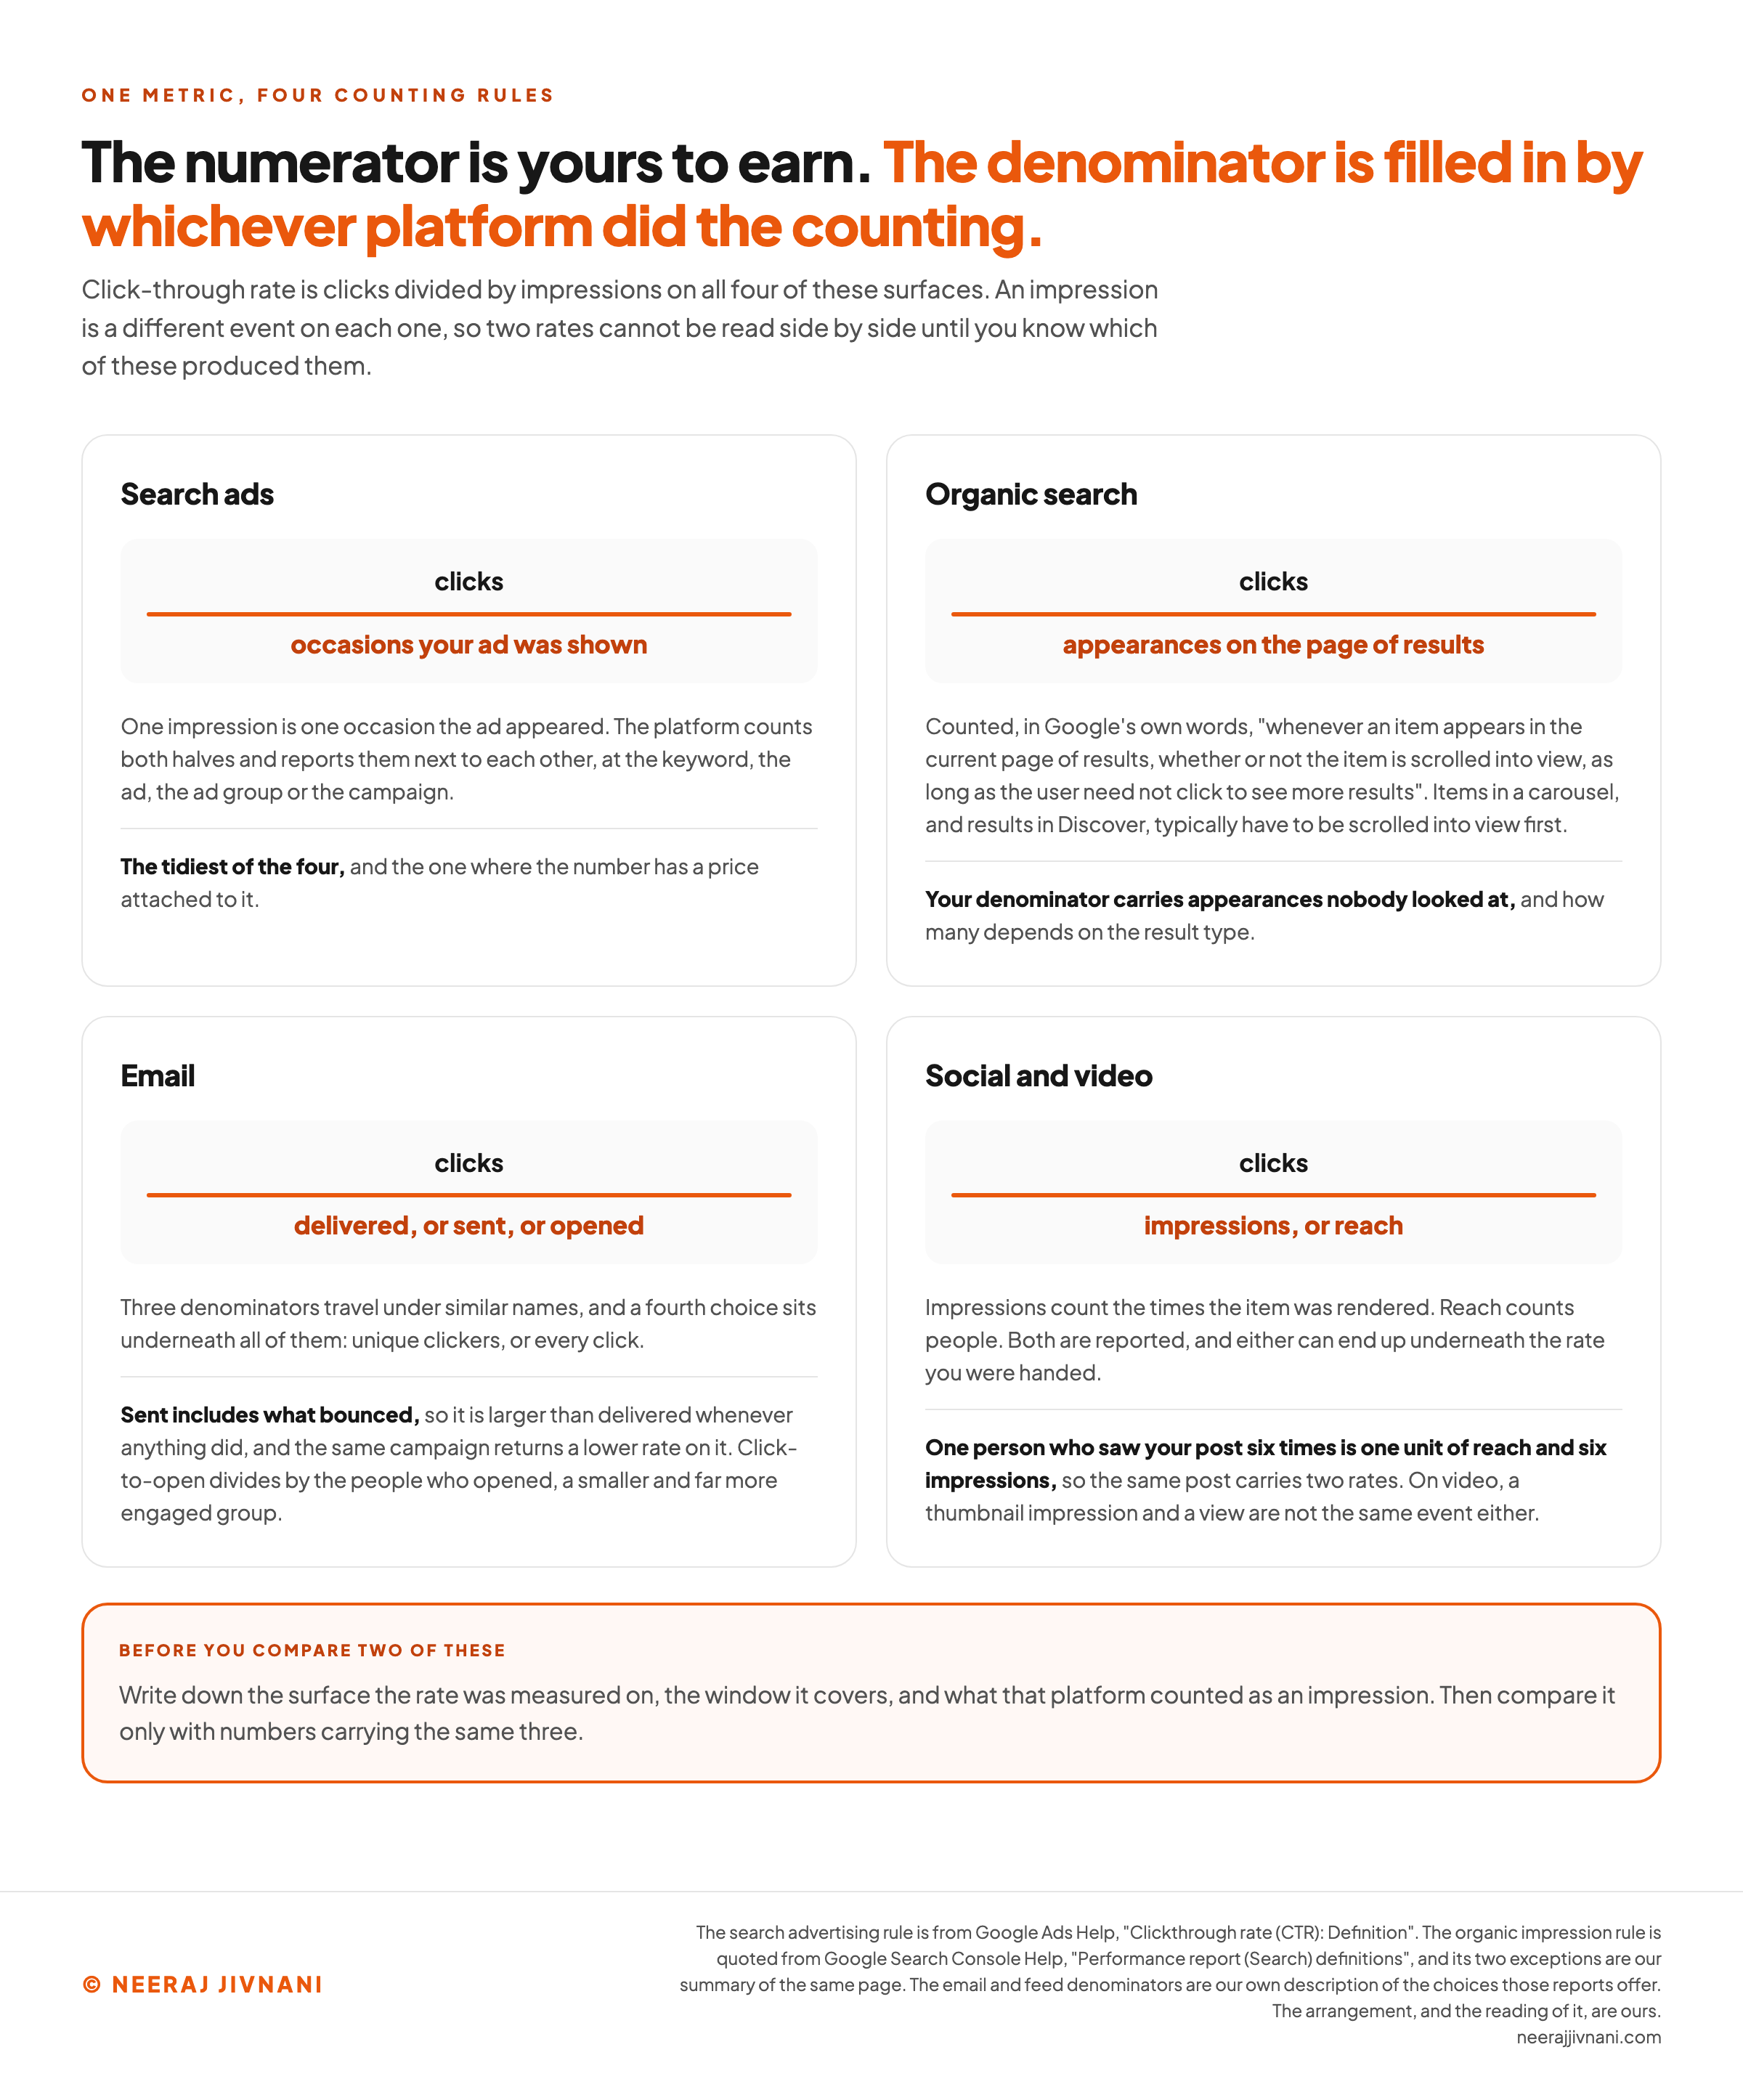
Four surfaces report this metric, and each one fills the bottom of the fraction with something different.
That is why two rates from two places cannot be read side by side without a translation. The rule for the surface you are on comes before the number on it.
Search ads, organic search, email and then the feeds.
Search Ads
In Google Ads, an impression is one occasion your ad was shown. Click-through rate is clicks divided by those impressions, at whatever level you are looking at: the keyword, the ad, the ad group or the campaign.
This is the tidiest of the four. The platform counts both halves and reports them next to each other.
It is also the one where the number has a price attached.
Organic Search
Search Console reports click-through rate for your pages in search results.
The counting rule underneath is looser than the formula suggests.
Google's Search Console documentation says an impression is counted "whenever an item appears in the current page of results, whether or not the item is scrolled into view, as long as the user need not click to see more results".
Read that twice.
For an ordinary web result, appearing on the page the searcher loaded is enough. They never had to scroll far enough to see you.
The rule is not uniform. Items inside a carousel, and results in Discover, typically have to be scrolled into view before Google counts an impression.
So your organic rate carries a quantity of appearances nobody looked at, and how many depends on the result type.
Two rates travel under similar names here.
One divides clicks by the messages that were delivered. The other, click-to-open rate, divides by the people who opened, a smaller and far more engaged group.
Two more choices sit underneath both: unique clickers or every click, and messages sent or messages delivered.
Sent includes what bounced, so it is the larger of the two whenever anything did.
A formula built on sent can only return a lower rate for the same campaign, never a higher one.
None of these is wrong. They are different questions, and your report answers one of them without saying which.
Social and Video
Feeds usually report against impressions, the count of times the item was rendered, and separately against reach, the count of people.
One person who saw your post six times is one unit of reach and six impressions. The same post therefore carries two different rates, depending on which the platform put underneath.
Video adds a third complication. A thumbnail impression and a view are not the same event, so a rate built on one says nothing about the other.
Use this chart — embed code and citation
<a href="https://neerajjivnani.com/blog/click-through-rate/"><img src="https://neerajjivnani.com/infographics/click-through-rate/four-denominators.png" alt="Diagram of four surfaces reporting click-through rate, each drawn as the same fraction with clicks on top and a different denominator underneath: search ads divide by the occasions the ad was shown, counted by the platform at the keyword, ad, ad group or campaign level; organic search divides by appearances on the page of results, counted whenever an item appears in the current page of results whether or not it is scrolled into view, with carousel items and Discover results as the two exceptions that must typically be scrolled into view first; email divides by delivered, sent or opened messages, with sent larger than delivered whenever anything bounced and click-to-open dividing by the smaller group who opened; and social and video divide by impressions or by reach, where one person who saw a post six times is one unit of reach and six impressions, and a thumbnail impression is not a view. A band across the foot says to write down the surface, the window and the impression rule before comparing two rates." width="1200"></a>
<p>Chart: <a href="https://neerajjivnani.com/blog/click-through-rate/">Neeraj Jivnani</a></p>Neeraj Jivnani, "Click-Through Rate: The Formula, and How to Read the Number You Get", neerajjivnani.com, https://neerajjivnani.com/blog/click-through-rate/Free to republish with a link back to this page.
What Growing Your Audience Does to the Number
The size of your audience decides the denominator, so the rate only holds if everybody you add is as likely to click as the people you already had.
Add people who are less likely and the rate falls, with nothing about the work having got worse.
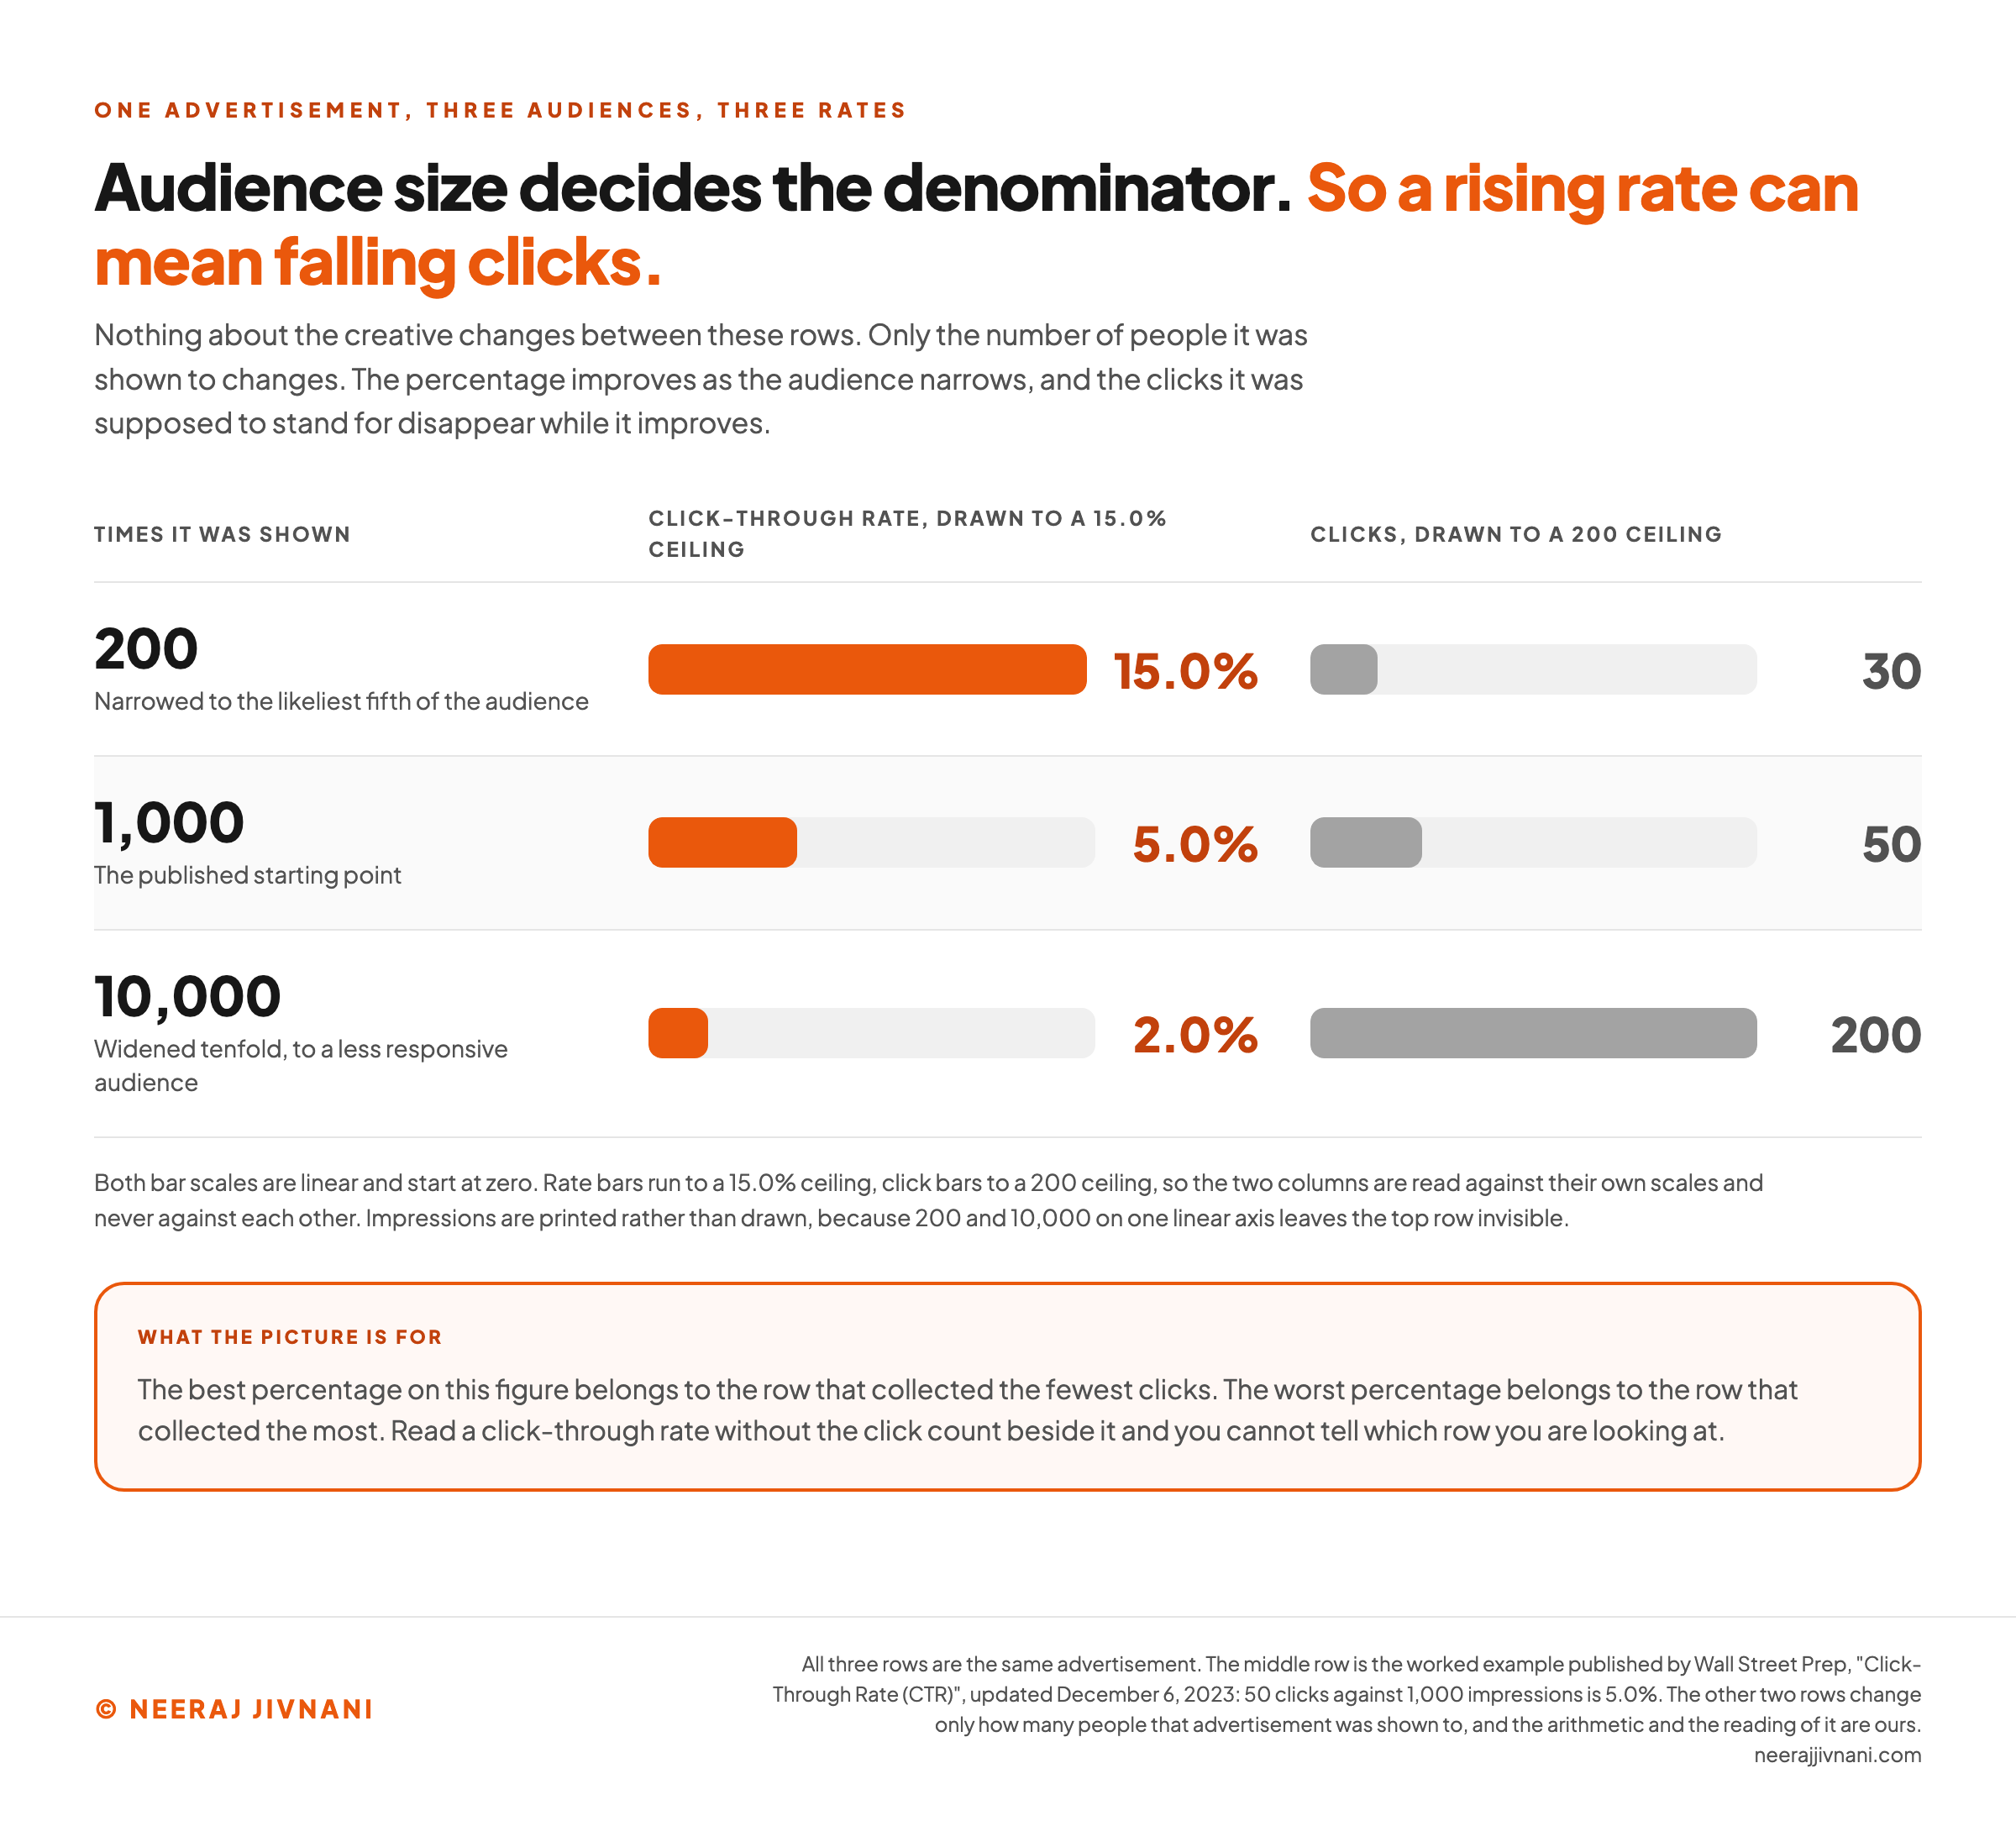
Watch it happen on the same 50 clicks in 1,000 impressions. Start there, and change only who sees the thing.
Narrow to the likeliest fifth of that audience, and suppose it still brings 30 of the 50 clicks.
It is now shown 200 times and earns 30, which is 15.0%. The rate has tripled, and 20 of the clicks are gone.
Widen it tenfold instead, to 10,000 impressions, and suppose the wider audience is less responsive so it brings 200 clicks. That is 2.0%.
The rate has fallen to two fifths of where it started, and the clicks have quadrupled.
| what changed | impressions | clicks | CTR |
|---|---|---|---|
| the published starting point | 1,000 | 50 | 5.0% |
| narrowed to the likeliest fifth | 200 | 30 | 15.0% |
| widened tenfold | 10,000 | 200 | 2.0% |
All three rows are the same advertisement.
So Read the Rate Next to the Count
Because the rate moved three times without the ad changing once, a movement in it is not evidence about the ad. That is why we read a rising click-through rate as a question rather than as a result.
The cheapest way to raise this number is to stop showing your work to people who might have been persuaded. That trade does not appear in the percentage.
So read clicks and rate together, always. A rate that improved while volume fell is a decision somebody made, and it ought to be one somebody made on purpose.
Use this chart — embed code and citation
<a href="https://neerajjivnani.com/blog/click-through-rate/"><img src="https://neerajjivnani.com/infographics/click-through-rate/rate-up-clicks-down.png" alt="Paired bar chart of one advertisement shown to three different sized audiences, with the click-through rate bars drawn to a 15.0 percent ceiling and the click bars drawn to a 200 ceiling, both scales linear and starting at zero: shown 200 times after narrowing to the likeliest fifth of the audience it records 15.0 percent and 30 clicks; shown 1,000 times at the published starting point it records 5.0 percent and 50 clicks; shown 10,000 times after widening tenfold to a less responsive audience it records 2.0 percent and 200 clicks. The rate bars shrink down the figure while the click bars grow, so the best percentage belongs to the row that collected the fewest clicks and the worst percentage to the row that collected the most." width="1200"></a>
<p>Chart: <a href="https://neerajjivnani.com/blog/click-through-rate/">Neeraj Jivnani</a></p>Neeraj Jivnani, "Click-Through Rate: The Formula, and How to Read the Number You Get", neerajjivnani.com, https://neerajjivnani.com/blog/click-through-rate/Free to republish with a link back to this page.
Click-Through Rate, Cost Per Click, and What You Pay
Cost per click is what one click costs you. Click-through rate is what share of appearances became clicks.
They are different numbers, and the reason people ask about the two together is that in search advertising the second moves the first.
Your rate feeds your keyword's expected click-through rate, which Google Ads Help calls "a component of Ad Rank". Ad Rank decides whether your ad shows, where it shows, and what you pay when it does.
A better click-through rate buys traffic and a cheaper auction on the same bid.
Quality Score and expected click-through rate are not the same thing, and it matters which one you work on.
Google says plainly that "Quality Score is not an input in the ad auction".
So work on the rate.
Conversion rate is the other number people set beside this one, and the two are not rivals.
One is measured on somebody else's surface and the other on yours.
Your Ad Account Already Publishes the Comparison
A good click-through rate is whatever beats the advertisers you are competing against, and on search ads your account already runs that comparison for you. It is free, and it goes unread.
Google Ads evaluates expected click-through rate for a keyword and gives it a status of "Above average", "Average" or "Below average".
The status is Google's own, set "based on a comparison with other advertisers whose ads showed for the exact same search over the last 90 days".
Same query, same competitors, same ninety days. No published table can offer that.
What the Grade Does and Does Not Say
Expected click-through rate is Google's estimate of how likely your ad is to be clicked when it shows. It is not a scorecard on the rate you already recorded.
A broad match keyword can also carry a Quality Score with no impressions of its own, borrowed from a matching exact match keyword in the same ad group, so read the grade as a direction rather than as a measurement.
Organic search has a rougher version of the same idea.
Search Console reports your average position beside your click-through rate, which lets you compare a page against your own other pages sitting at a similar position.
A result at the top of the page and the same result near the foot of it are not being offered the same chance.
So a comparison that does not hold position still is comparing two different things.
A good CTR ratio, then, has a shape rather than a value. It is your number, on one surface, against the closest honest reference that surface gives you.
On paid search that reference is published inside your account, and on organic search you build it from your own pages.
We publish no target percentage here, and that is deliberate.
Hold the rate, or hold the clicks
There is no target percentage to check yours against, so this checks nothing. Put in the two numbers behind your own rate, say which surface counted them, then move the audience. The same piece of work produces two entirely different reports, and both of them are true.
1. The two numbers behind your rate
Your rate
5%
Those two are the published starting point, 50 clicks against 1,000 impressions. Type your own over them.
2. Which surface counted the bottom half
You counted neither half of this fraction. Say who did:
Until that is answered the percentage is unreadable, because an impression is a different event on each of the four.
3. Now change who sees it, and nothing else
Same creative, same offer, same landing page. Show it to:
Shown 200 times instead of 1,000. Two true readings.
Hold the rate
10 clicks
and the report still reads 5%
The new audience responds exactly as the old one did. Your percentage is unchanged, and 40 of the clicks are gone.
Hold the clicks
25%
on the same 50 clicks you already had
Everybody who was going to click still clicks. The rate is five times what it was, and not one extra person came.
Your real result sits somewhere between those two, and the percentage on its own does not say where. The cheapest way to reach the right hand box is to stop showing your work to people who might have been persuaded, and that trade does not appear anywhere in the percentage.
So report both. 50 clicks at 5% became somewhere between 10 and 50 clicks at somewhere between 5% and 25%. Only one of those two columns is the business.
When a Higher Rate Is the Wrong Thing to Want
A click-through rate measures the promise, not the product. That makes it the easiest marketing number to improve, and one of the easiest to improve destructively.
Every click costs you something: budget in paid, and attention in organic, where a searcher who bounces straight back has learned that your result overstated itself.
A high rate with nothing behind it is a symptom rather than a paradox. It usually points at one of three things.
- The promise was wider than the product. The headline described something more general, cheaper or more universal than what the page delivers, and the extra clicks came from people the product was never for.
- The click was ambiguous. People clicked to find out what it was, not because they wanted it. Curiosity converts badly.
- The audience was right and the page was not. Here the rate is telling the truth, and the problem sits after the click.
Telling them apart takes one look at the segment whose rate moved.
If the extra visitors do nothing at all, the promise was too wide or too vague, so fix the copy. If they behave like your usual visitors and the page fails to hold them, fix the page.
Our position on this is blunt. Never optimize a click-through rate on its own, and never report one without the volume and the outcome beside it.
What Actually Raises It
Three things you control move this number: the promise, the placement and the audience. Nothing else you do reaches it except through one of those three.
They are worth separating because they cost different amounts and they fail in different ways.
And only one of them can raise the rate while making everything else worse, so name the lever before you pull it.
The Promise
What the person sees before they decide. The headline, the first line of description, the thumbnail, the subject line.
Say what the click gets them, specifically, in the words they would use. Most weak copy here is not badly written, it is vague, describing a category when the reader wants an outcome.
Then match it to what waits on the other side. A promise the page keeps is worth more than a promise that wins the click, because the second one charges you twice.
The Placement
Where the thing appears, which often matters more than what it says.
In paid search that means your bid, your relevance and the formats your ad qualifies for.
In organic search it means your position, and in a feed it means whatever the ranking system decided that morning.
This is the lever reached for last and it is frequently the largest. Moving from the middle of a results page to the top changes who ever sees your line at all, which no rewrite can do.
The Audience
Who is being shown it. Change this and the rate moves whatever the copy says.
Tightening an audience raises the rate mechanically. That is worth doing when you were reaching people who could never buy, and a bad trade when you were reaching people who might have.
The honest test is a count, not a percentage. After the change, are there more of the outcomes you wanted, in absolute numbers?
If not, the rate improved and the business did not.
Testing sits underneath all three. Change one element, run it long enough that the difference is real rather than a good week, and keep what wins.
Organic Search Is the Surface You Steer Least
Organic search is where the least of the denominator is yours.
You can work on your position, your title and your description. You cannot touch what the results page puts above them.
A page carrying an AI Overview, a featured snippet, a video block, a shopping row and a set of people-also-ask questions gives a plain blue link a different job from the one it used to have.
Your listing can hold its position and still lose clicks, because the page around it answered the question first.
The impression is counted anyway. Appearances go up, the answer moves above you, and the rate falls without anything of yours changing.
Say a page holds exactly the same average position across two quarters and its rate falls anyway. Nothing you wrote caused that.
So read organic click-through rate against your own position history rather than against a target. If your position held and your rate dropped, the result page changed shape.
And pick the queries where a click is still the point.
A question with a short factual answer is being resolved on the results page.
Queries where somebody wants to compare, buy, download or read something long still send people onward. Those are where a better promise still pays.
Three Things to Write Down Beside It
Before you act on a click-through rate, record the surface it was measured on, the window it covers, and what the platform counted as an impression.
Two rates are comparable only when all three match.
Your ad account will do that comparison for you on paid search, against the exact same searches. Search Console will let you do it for yourself on organic, once you hold position still.
The number is worth watching, and it is worth watching next to the click count.
A rate that climbed while the clicks fell is a smaller audience, not a better message. Only one of those is progress.