Competitive Analysis: What to Compare, What to Ignore, and What to Change
Learn which competitor details decide your buyer's choice, where to get them without paying for a tool, and how to turn the grid into a decision.

/ On this page9 sections
A competitive analysis is worth doing when it changes a decision. Most of what you could collect about a competitor will not change one, because it only confirms that they also have a pricing page, a blog and a login button.
The work is picking the handful of things a customer genuinely chooses on, then finding out where you stand on those.
Almost all of that information is free, and most of it is published by the competitor.
What Competitive Analysis Is
Competitive analysis is the work of finding out what the other companies your buyers consider are selling, charging, promising and publishing, and then deciding what you will do differently. Competitor analysis and competition analysis mean the same thing.
It exists to answer one question. Given what everybody else already offers, what should you do that is not the same?
Everything in the exercise is either evidence toward that answer or filler.
That is also how you tell whether yours worked. A finished analysis names something you will now do, or stop doing, that you would not have done otherwise.
The Five Steps, Short Version
Here is the whole sequence in one place, in the order the sections below work through it.
- Decide the decision. Name the choice this has to inform before you collect anything, because it decides what is worth collecting.
- Build the competitor set. The direct ones, the indirect ones, and whatever the customer is using today instead of any of you.
- Collect against a fixed attribute list. The same questions for every competitor, so the answers line up in a grid.
- Read the grid for difference. Set aside the rows where everybody matches and study the ones where they do not.
- Write down what changes. One decision, one owner, one date.
Who Counts as a Competitor
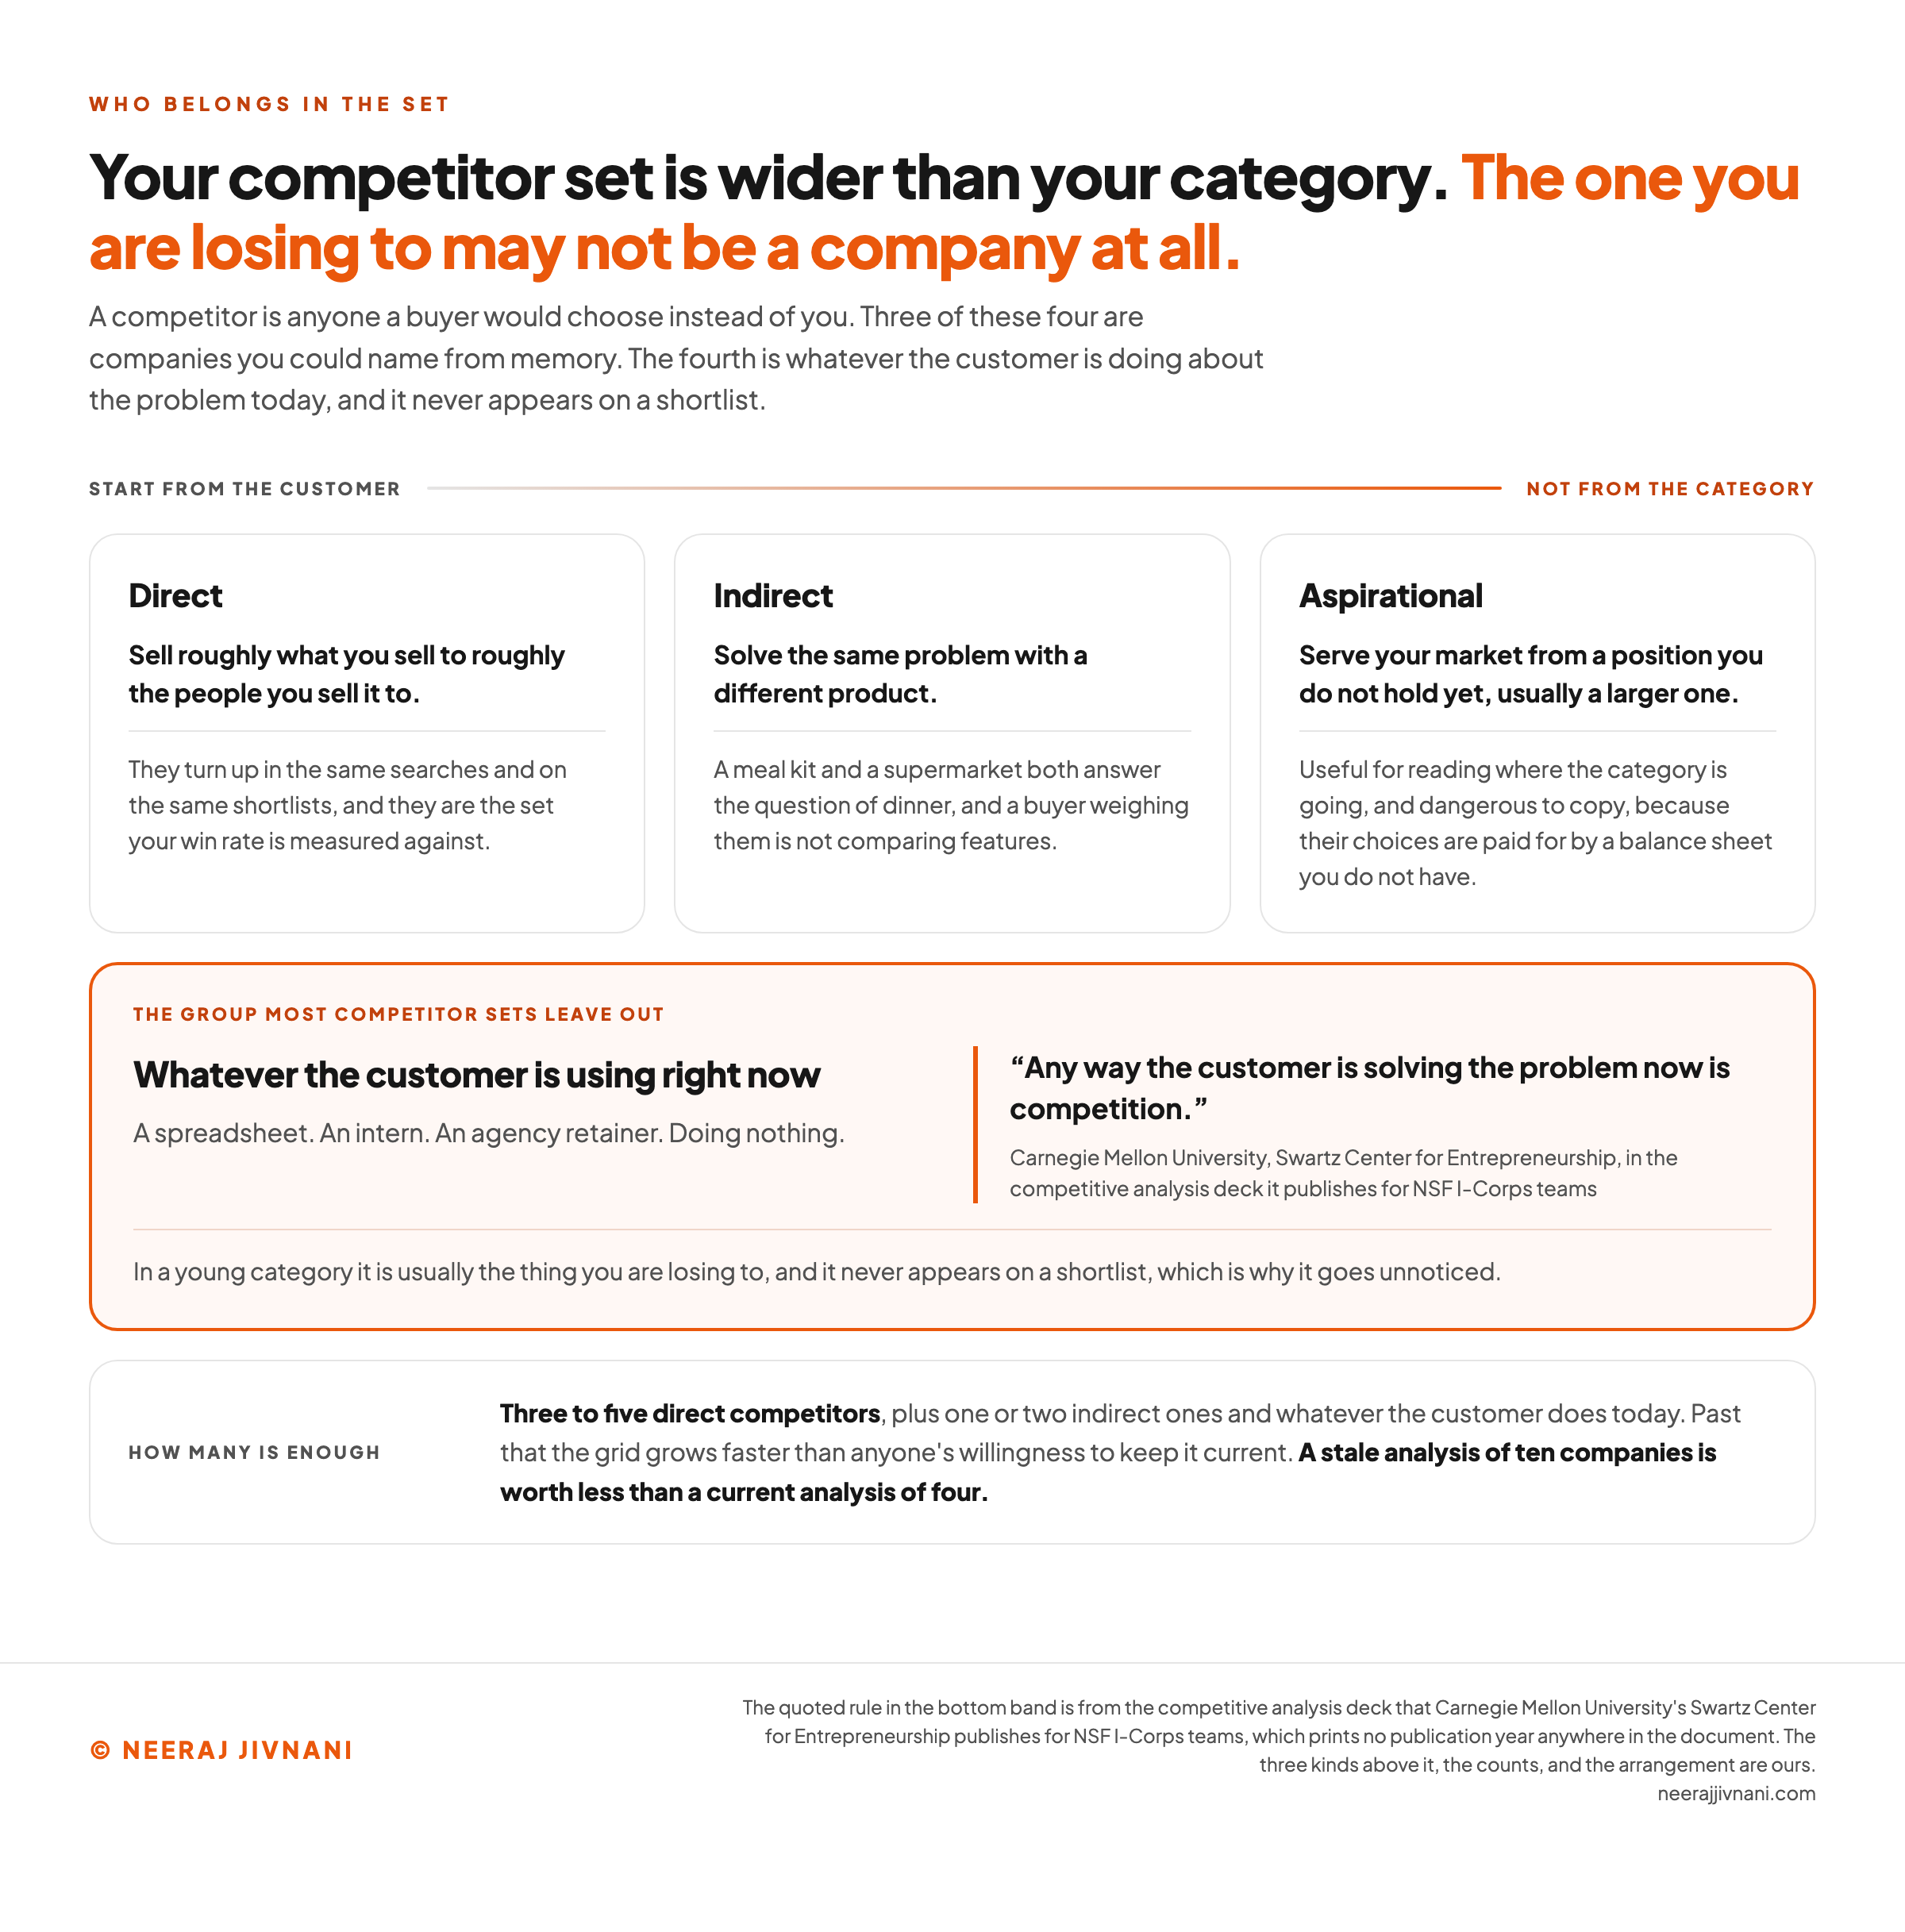
A competitor is anyone a buyer would choose instead of you, which is a wider group than the companies you would name if somebody asked. Start from the customer, not from the category.
Three kinds are worth separating, because each one is useful for something different.
Direct competitors sell roughly what you sell to roughly the people you sell it to. They turn up in the same searches and on the same shortlists, and they are the set your win rate is measured against.
Indirect competitors solve the same problem with a different product. A meal kit and a supermarket both answer the question of dinner, and a buyer weighing them is not comparing features.
Aspirational competitors serve your market from a position you do not hold yet, usually a larger one. They are useful for reading where the category is going and dangerous to copy, because their choices are paid for by a balance sheet you do not have.
Then there is the group most competitor sets leave out.
Write down what the customer is using today, whatever it is. Carnegie Mellon University's Swartz Center for Entrepreneurship states it as a rule in the competitive analysis deck it publishes for NSF I-Corps teams: "Any way the customer is solving the problem now is competition."
That covers a spreadsheet, an intern, an agency retainer, and doing nothing. In a young category it is usually the thing you are losing to, and it never appears on a shortlist, which is why it goes unnoticed.
How Many Is Enough
Enough that you could rebuild the whole thing in an afternoon.
Three to five direct competitors is usually enough, plus one or two indirect ones and whatever the customer does today. Past that the grid grows faster than anyone's willingness to keep it current.
A stale analysis of ten companies is worth less than a current analysis of four.
Use this chart — embed code and citation
<a href="https://neerajjivnani.com/blog/competitive-analysis/"><img src="https://neerajjivnani.com/infographics/competitive-analysis/wider-than-your-category.png" alt="Diagram of a competitor set drawn as four groups along a line running from starting with the customer to not starting with the category: direct competitors, who sell roughly what you sell to roughly the people you sell it to and turn up in the same searches and on the same shortlists; indirect competitors, who solve the same problem with a different product, with a meal kit and a supermarket both answering the question of dinner; aspirational competitors, who serve your market from a position you do not hold yet and whose choices are paid for by a balance sheet you do not have; and, in a highlighted band beneath the other three, whatever the customer is using right now, which covers a spreadsheet, an intern, an agency retainer and doing nothing, set beside Carnegie Mellon University's rule that any way the customer is solving the problem now is competition. A closing panel says three to five direct competitors is usually enough, plus one or two indirect ones and whatever the customer does today, because a stale analysis of ten companies is worth less than a current analysis of four." width="1200"></a>
<p>Chart: <a href="https://neerajjivnani.com/blog/competitive-analysis/">Neeraj Jivnani</a></p>Neeraj Jivnani, "Competitive Analysis: What to Compare, What to Ignore, and What to Change", neerajjivnani.com, https://neerajjivnani.com/blog/competitive-analysis/Free to republish with a link back to this page.
What to Compare
Compare what they sell, what it costs, who it is aimed at, how a buyer reaches it, what they publish, and what their customers say in public. Those six cover almost every decision a competitive analysis is asked to inform.
Pick the attributes before you open the first competitor's website. Otherwise you collect whatever each site makes prominent, and the answers never line up into anything you can read across.
Keep the list to about a dozen rows.
A grid with forty attributes takes a week to fill and still will not say what to do, because the few rows that matter are buried in the rest.
The Four Ps, and What They Do Not Cover
The four Ps of competitor analysis are product, price, place and promotion, borrowed from the marketing mix and pointed at somebody else's business.
Product is what the thing does, what it leaves out, and where quality is visibly different. Price is the published number, the packaging around it, and what a discount buys.
Place is where a buyer can get it: direct, through a marketplace, through resellers, in which countries. Promotion is what they publish, where they publish it, and the claim they lead with.
It is a sound checklist with one limit worth saying out loud.
The four Ps describe what a competitor sells, so they will not tell you how the company wins.
Cost structure, distribution deals, switching costs and who owns the customer relationship all sit outside them, and any one of those can decide all four Ps on its own.
The Rows That Separate You
Fill the grid and something uncomfortable happens. Most of the rows come back identical.
Everybody has the self-serve trial, the status page, the integration directory and the chat widget. Those rows are the price of entry: they tell you what you must have, and nothing about what to do next.
The analysis lives in the rows where the answers differ.
Compare four competitors on twelve attributes and ten of them will usually match. Those ten are table stakes, and the two that do not are the whole competitive question.
Weight those two. Ignore the rest for the purposes of this decision, while continuing to ship them, because table stakes are only invisible when you have them.
A customer chooses on price, service and quality, and a business can compete on at most two of the three. That is what Carnegie Mellon's deck argues, and it is a ceiling on how many things you can win on at once.
The exact number matters less than the discipline behind it. Naming the row you have decided to be worse at is a harder output than a list of gaps, and a more useful one.
What Their Customers Say
Reviews, ratings and public support threads are the one place a competitor does not write the copy.
Read the two-star and three-star reviews rather than the one-star ones.
A one-star review is often a billing dispute. A two-star or three-star review is usually somebody who likes the product and is telling you the exact point where it stops working for them.
Those middle reviews are where you find the row your own grid was missing.
Where the Information Comes From
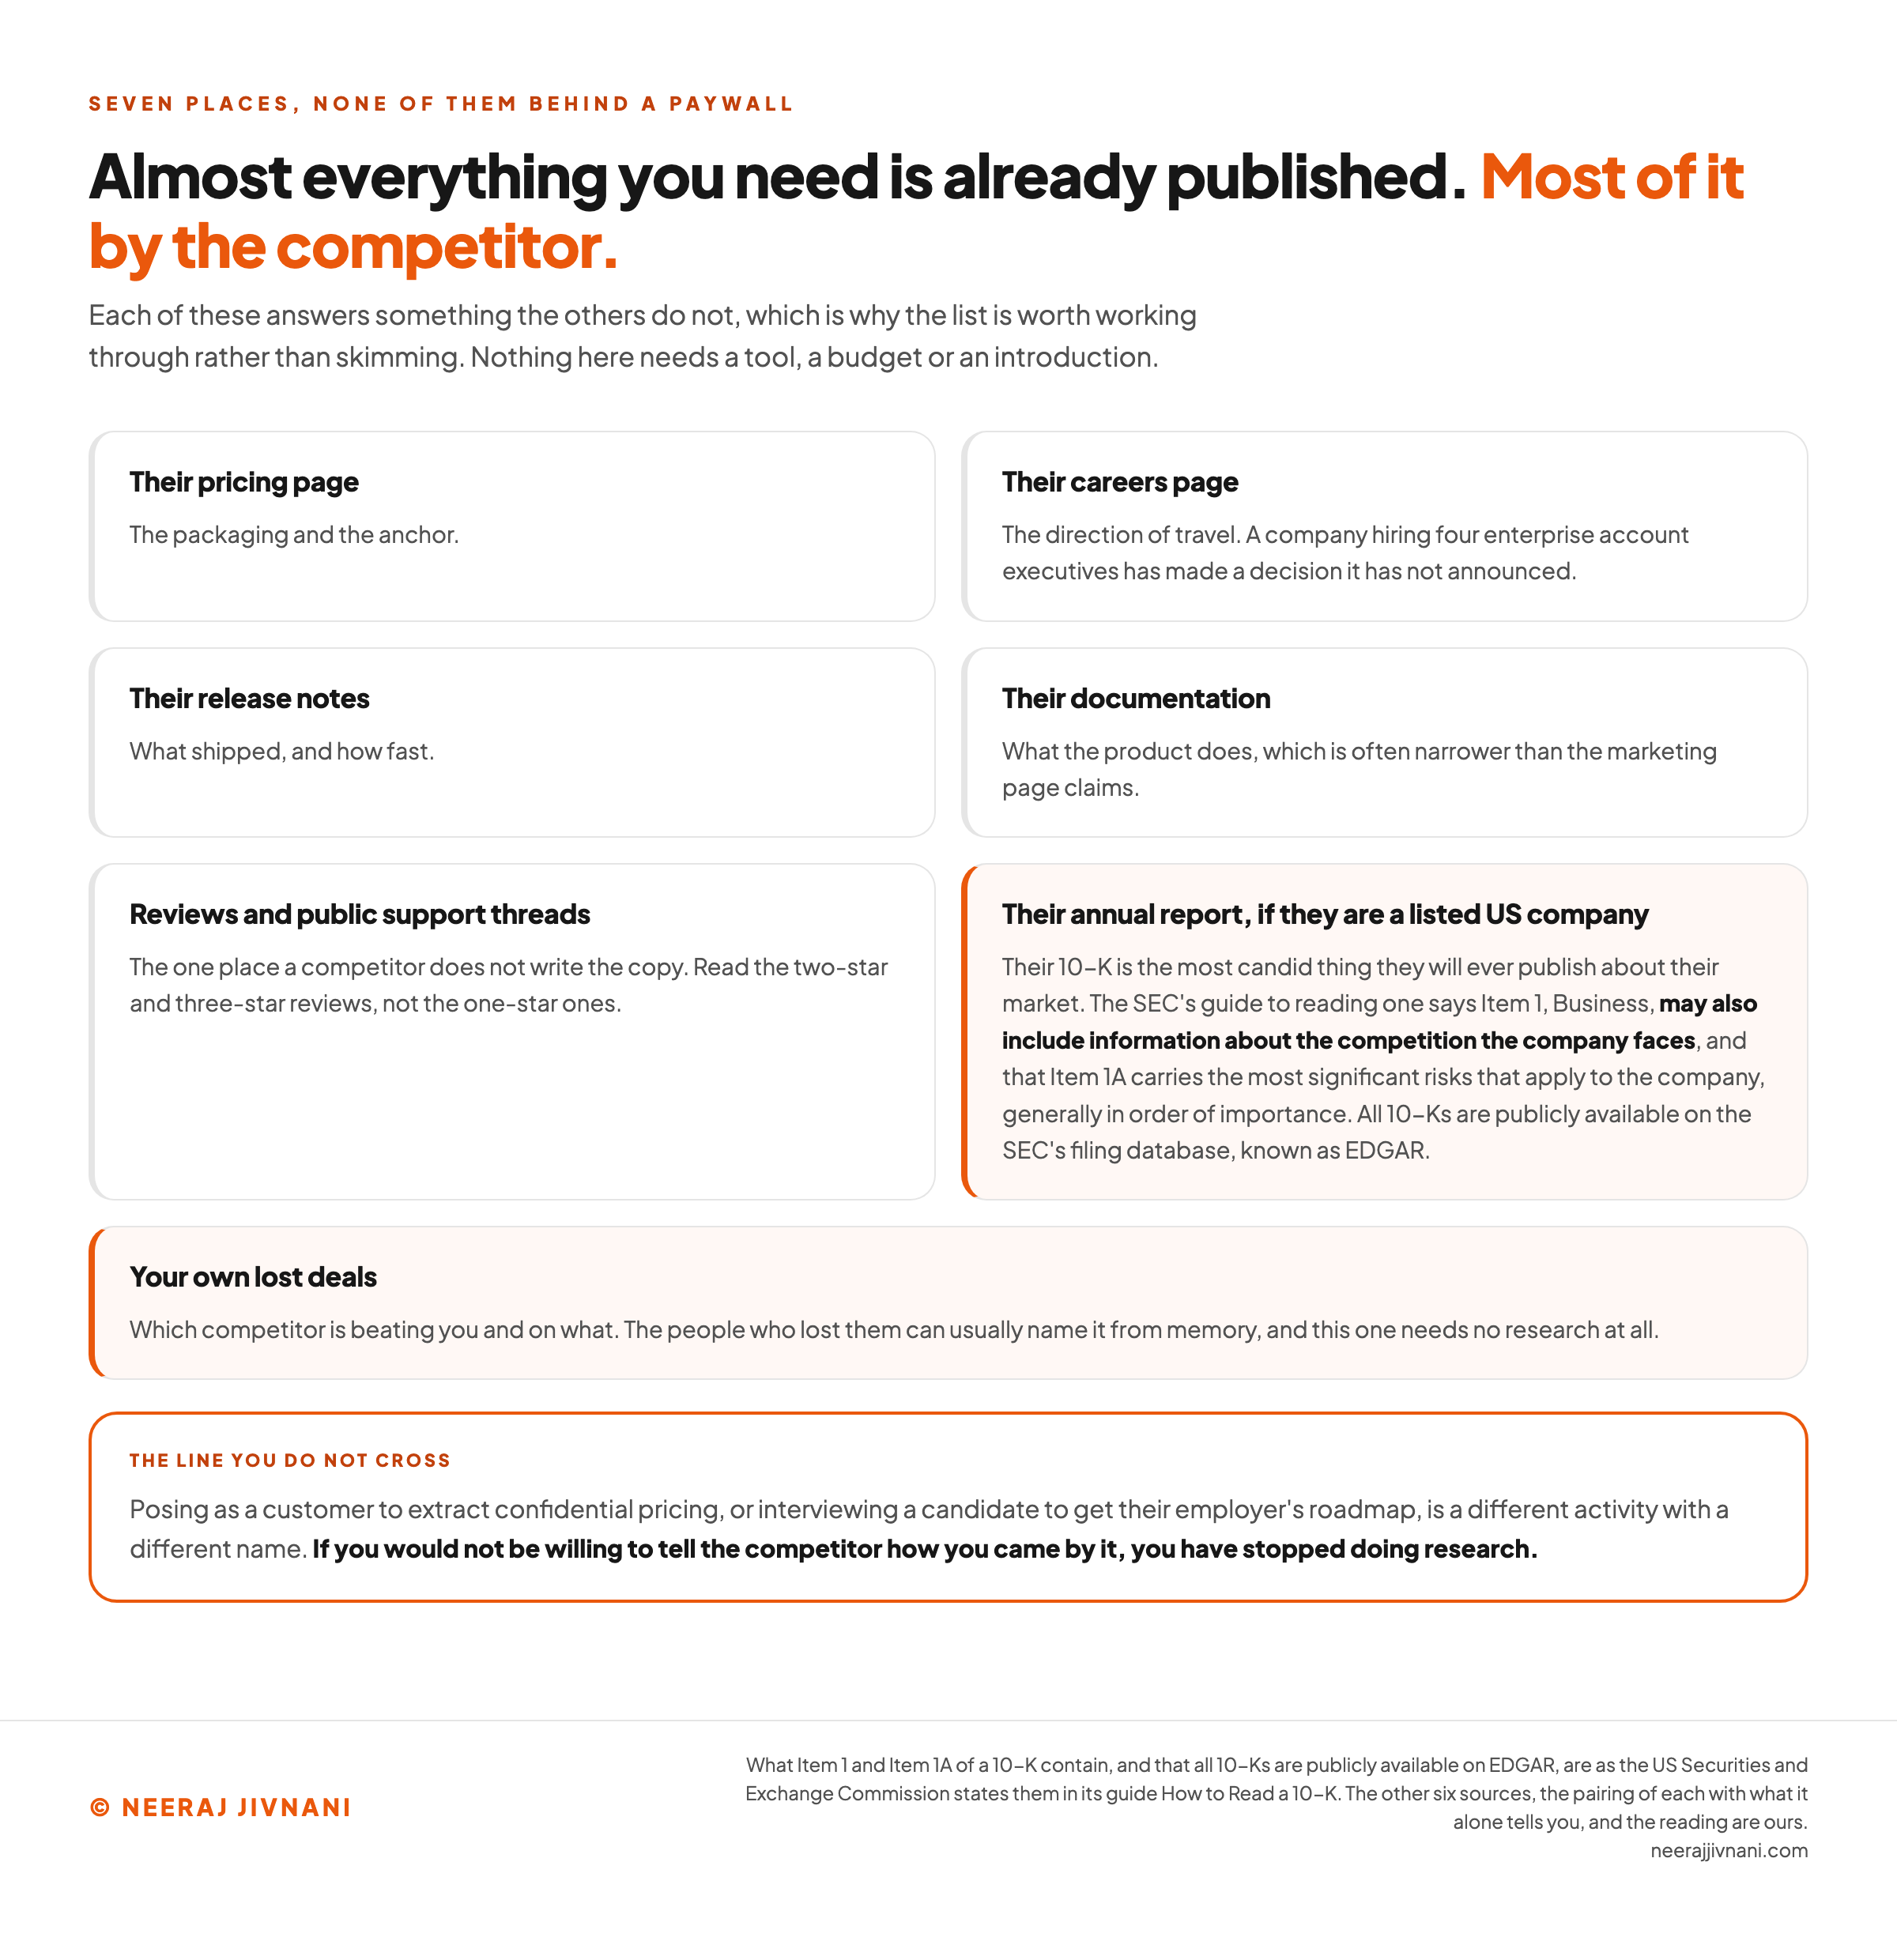
The competitor publishes most of what you need, and the rest is public too. Pricing pages, careers pages, release notes, documentation, filings, review sites, and your own lost deals.
Their pricing page gives you the packaging and the anchor. Their careers page gives you the direction of travel, because a company hiring four enterprise account executives has made a decision it has not announced.
Their release notes tell you what shipped and how fast. Their documentation tells you what the product does, which is often narrower than the marketing page claims.
If a competitor is a listed US company, its 10-K, the annual report it files with the US Securities and Exchange Commission (SEC), is the most candid thing it will ever publish about its market.
The business section, Item 1, may also include information about the competition the company faces, alongside the regulations that apply to it, according to the SEC's own guide to reading a 10-K.
The risk factors that follow it, in Item 1A, are where a company sets down the most significant risks that apply to it, generally in order of importance.
All 10-Ks are publicly available on the SEC's filing database, known as EDGAR.
Then there is the source that needs no research at all. Your own lost deals already contain the answer to which competitor is beating you and on what, and the people who lost them can usually name it from memory.
The Line You Do Not Cross
Everything above is public. Posing as a customer to extract a competitor's confidential pricing, or interviewing a candidate to get their current employer's roadmap, is a different activity with a different name.
The test is uncomfortable and reliable. If you would not be willing to tell the competitor how you came by it, you have stopped doing research.
What a Model Can and Cannot Do Here
An assistant is useful for the mechanical half of this work: summarizing a long pricing page, pulling the themes out of a pile of reviews, drafting the attribute list before you edit it.
It is not a source. Ask what a competitor charges and you may get a confident number from a page that changed last spring, with nothing in the answer to tell you which.
Treat it as a fast reader, never as a researcher, and check every figure against the page it came from.
There is a second reason to care about this. Buyers now get category questions answered by assistants as well as by a page of links, so how you and your competitors get described in those answers is itself a row worth adding to the grid.
Use this chart — embed code and citation
<a href="https://neerajjivnani.com/blog/competitive-analysis/"><img src="https://neerajjivnani.com/infographics/competitive-analysis/where-it-is-published.png" alt="Diagram of seven public places a competitive analysis gets its information, each paired with what it alone tells you: their pricing page for the packaging and the anchor; their careers page for the direction of travel, because a company hiring four enterprise account executives has made a decision it has not announced; their release notes for what shipped and how fast; their documentation for what the product does, which is often narrower than the marketing page claims; reviews and public support threads, the one place a competitor does not write the copy, where the two-star and three-star reviews are the ones to read; their annual report to the SEC, the 10-K, where the Commission's own guide to reading one says Item 1 may also include information about the competition the company faces, Item 1A carries the most significant risks that apply to the company, generally in order of importance, and all 10-Ks are publicly available on the SEC's filing database, known as EDGAR; and your own lost deals, which need no research at all. A highlighted band at the foot carries the test that if you would not be willing to tell the competitor how you came by it, you have stopped doing research." width="1200"></a>
<p>Chart: <a href="https://neerajjivnani.com/blog/competitive-analysis/">Neeraj Jivnani</a></p>Neeraj Jivnani, "Competitive Analysis: What to Compare, What to Ignore, and What to Change", neerajjivnani.com, https://neerajjivnani.com/blog/competitive-analysis/Free to republish with a link back to this page.
The Frameworks People Will Ask You For
Three frameworks come up often enough that somebody in the room will name one. Each answers a different question, and reaching for the wrong one is how a competitive analysis turns into a slide with four boxes on it.
None of them collects anything. A framework is a way of arranging findings you already have, so a framework applied to an empty grid produces confident-looking boxes with nothing inside them.
Fill the grid first. Then pick the frame that suits the question you were asked.
SWOT
SWOT, short for strengths, weaknesses, opportunities and threats, sorts what you already found into four boxes.
Strengths and weaknesses are internal and yours. Opportunities and threats are external and belong to the market.
That split is the entire discipline of it, and it is the part people drop.
A competitor's new feature is a threat, not a weakness of yours. Filing it as a weakness quietly converts the grid into a build list, which is the failure this whole exercise exists to avoid.
Run one SWOT, for yourself, informed by the competitor grid. Running a separate SWOT for each competitor produces four documents and no decision.
Porter's Five Forces
Five forces looks at the structure of an industry rather than at named companies: the bargaining power of buyers and of suppliers, the threat of new entrants and of substitutes, and the rivalry among the competitors already there.
Use it when the question is whether this market is worth being in. It will not help you choose between two positioning statements, because both of them sit inside the same five forces.
Strategic Group Mapping
A strategic group map plots every competitor on two axes that matter to buyers. Price against breadth, say, or self-serve against high-touch.
Its value is in the empty space rather than the dots. Competitors cluster, and a gap between clusters is either a position nobody has served or a position somebody already proved does not pay.
Assume the second until you have evidence for the first.
One Grid, Filled In
The reading is easier to see on a filled grid than to describe, so here is a worked example, read line by line.
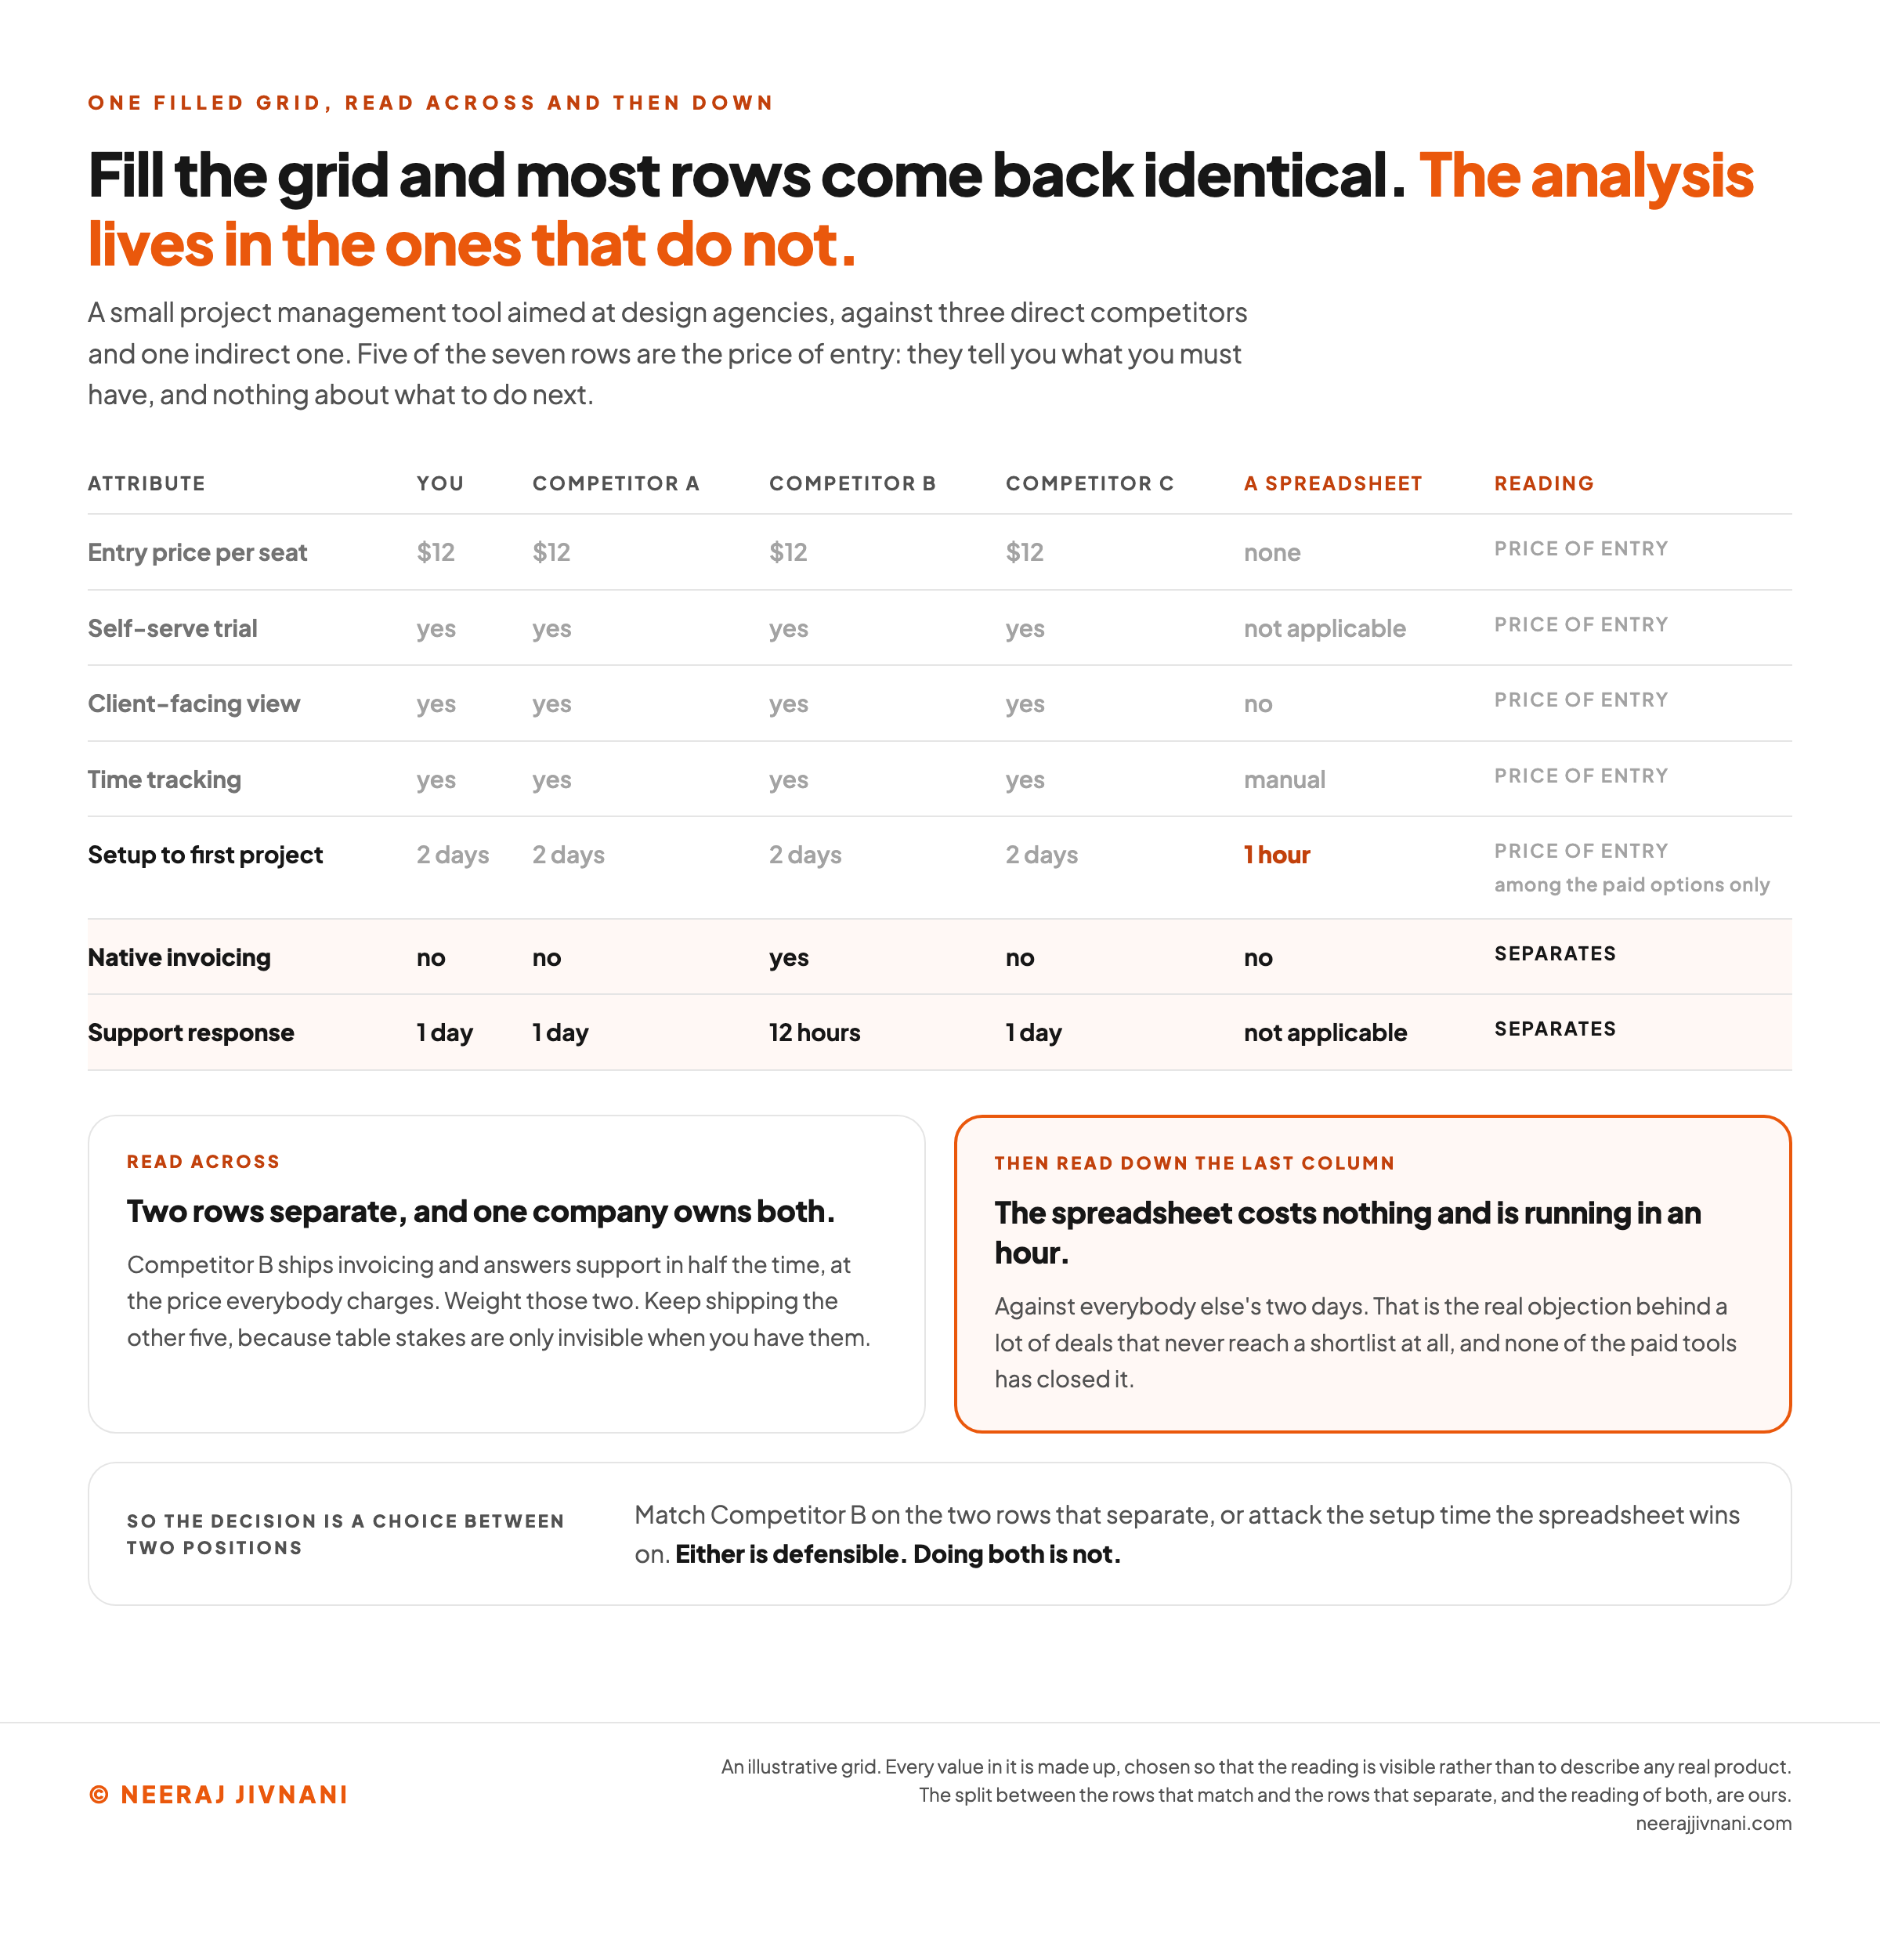
Say a small project-management tool aimed at design agencies is deciding what to build next quarter. The set is three direct competitors plus one indirect one, which here is the shared spreadsheet many of its prospects still run on.
The attributes are the ones its own lost deals kept naming.
Every number below is made up, chosen so the reading is visible rather than to describe any real product.
| Attribute | You | Competitor A | Competitor B | Competitor C | A spreadsheet |
|---|---|---|---|---|---|
| Entry price per seat | $12 | $12 | $12 | $12 | none |
| Self-serve trial | yes | yes | yes | yes | not applicable |
| Client-facing view | yes | yes | yes | yes | no |
| Time tracking | yes | yes | yes | yes | manual |
| Setup to first project | 2 days | 2 days | 2 days | 2 days | 1 hour |
| Native invoicing | no | no | yes | no | no |
| Support response | 1 day | 1 day | 12 hours | 1 day | not applicable |
Reading the Grid
Read the rows, not the columns.
Five of the seven are identical across every paid option. Against those three companies, price, the trial, the client view, time tracking and setup time win you nothing, and losing any of them would cost you the deal.
Two rows separate, and one company owns both. Competitor B ships invoicing and answers support in half the time, at the price everybody charges.
Now look down the last column instead. The spreadsheet costs nothing and is running in an hour against everybody else's two days, which is the real objection behind a lot of deals that never reach a shortlist at all.
So the decision is not "build invoicing because Competitor B has it".
It is a choice between two positions. Match Competitor B on the two rows that separate, or attack the setup time that the spreadsheet wins on and none of the paid tools has closed.
Either is defensible. Doing both is not, and filling every gap is how you end up with a slower version of Competitor B.
The rows that separate you
Put your own attribute rows in, one at a time, and say what each one came back as across the competitors you compared. Nothing is graded and nothing is scored. The only question is how much of your grid was ever carrying information.
About a dozen rows is the working size. A longer list costs days to fill and still leaves you without an answer.
Add the attributes you compared on, and the split appears here. Use the ones your own lost deals keep naming, and use the same questions for every competitor, so the answers line up.
Use this chart — embed code and citation
<a href="https://neerajjivnani.com/blog/competitive-analysis/"><img src="https://neerajjivnani.com/infographics/competitive-analysis/five-rows-match-two-decide.png" alt="Table of an illustrative competitor grid for a small project management tool aimed at design agencies, with seven attribute rows across three direct competitors, its own column and one spreadsheet column. Five rows are dimmed and marked price of entry because the four paid columns answer them identically: entry price per seat at $12 each, a self-serve trial, a client-facing view, time tracking, and 2 days to set up a first project. Two rows are highlighted and marked as separating, and Competitor B owns both: native invoicing, which only it ships, and a 12 hour support response against 1 day for everybody else. In the spreadsheet column the setup row reads 1 hour, called out in orange against everybody else's two days. Two panels below read the grid across and then down, and a closing panel says the decision is a choice between matching Competitor B on the two rows that separate and attacking the setup time, and that either is defensible while doing both is not." width="1200"></a>
<p>Chart: <a href="https://neerajjivnani.com/blog/competitive-analysis/">Neeraj Jivnani</a></p>Neeraj Jivnani, "Competitive Analysis: What to Compare, What to Ignore, and What to Change", neerajjivnani.com, https://neerajjivnani.com/blog/competitive-analysis/Free to republish with a link back to this page.
Where It Goes Wrong
Most grids that get built and then ignored went wrong in one of four ways.
- Confirmation bias. You already believe the competitor is winning on price, so the evidence for that gets collected and the row where they beat you on onboarding gets a shrug. Write down what you expect to find before you look, then check which expectations survived contact with the grid.
- Treating every gap as an opportunity. A feature they do not have may be one they built and removed. Look for the announcement that is missing and the support thread that explains why before you commit a quarter to it.
- Copying the leader row by row. A grid full of gaps reads like a to-do list, and working through it produces a slightly worse version of the market leader. The useful reading is the inverse: which rows are you choosing to lose so you can win the two that matter.
- Building it once. An analysis nobody maintains becomes a document people quote for prices that changed a year ago, which is worse than having none, because a written number is rarely doubted.
How Often to Do It Again
Rebuild the grid when the decision it feeds comes round again, and watch four things continuously in between.
A refresh on a fixed calendar is the usual answer, and it is the wrong shape for the work.
Say your largest competitor reprices in February. A grid rebuilt on a January-to-April cycle tells you about it in April, roughly two months after the pricing conversation that needed it.
Split the job in two instead.
The full rebuild belongs to the planning cycle, because that is when the decision it feeds is taken again. Between those, four sources carry nearly all the movement.
Pricing pages, release notes, careers pages, and the reason lines on the deals you lose.
A change-detection alert on the first three and a monthly read of the fourth will surface the moves that matter within a week, and none of it needs maintaining.
There is a blunter version of this rule. The usual failure is not a grid that went stale, it is a grid nobody opened again, and a document nobody opens changes no decisions at all.
What a Finished Analysis Should Change
A finished analysis should change exactly one decision, and that decision needs a name, an owner and a date on it.
The output is not the grid. It is a sentence somebody can act on: we are going to do this, because they all do that.
Put the grid underneath it as the evidence.
Three things belong in the written version:
- The competitor set, and why those companies are in it and others are not.
- The rows where you differ, and which way each one runs.
- The decision, with the name of whoever owns it and the date it gets reviewed.
Everything else is an appendix, and most of it will not be read.
One thing belongs there that almost never makes it in. A competitive analysis is a claim about a market that keeps moving, so it should say what would make it wrong.
Name the competitor move that would reverse your decision. Then you will notice it when it happens, instead of spending a meeting arguing about whether it counts.