Intent Data: Where the Signal Comes From, and What It Can Tell You
Which companies are researching your category, how a surge score is calculated, and the four things a feed can never tell you before you buy.


/ On this page9 sections
Intent data is a record of what people at a company read online, matched to the company rather than to the person, and sold as a sign that the company may be shopping. What separates one feed from another is where those readings come from, and there are four different places.
A surge score sits on top of that collection, arithmetic against a baseline rather than a judgment, so a quiet account that has started reading can outrank one that always has.
None of it tells you who has decided to buy. It tells you who has been reading, which is a timing hint and a useful one, as long as you know which of the four places your feed reads from.
What Intent Data Is, and the Line Between Interest and Intent
Intent data is behavioral information collected online and used to predict buying. It goes by two other names on vendor pages, buyer intent data and purchase intent data, and all three mean the same thing.
The word doing the work is behavioral. Third-party intent is reading that happened somewhere you have no relationship with, other people's articles, content networks, research sites, sorted by the topic it was about.
This is sold almost entirely for business-to-business use, and the reason is structural. A single consumer's browsing is one person's browsing. A company's is many people at once, and their reading can be pooled into one account-level pattern.
Interest is not intent, and the gap between them is where most of the disappointment lives.
The useful separation is one of intensity. Strong intent is clicks, scrolls, downloads and keyboard activity around a call to action, measured through engagement, and weak intent is the absence of it, which is how Dreamdata draws the line.
Strip the marketing language and what a feed can indicate is five things, on Demandbase's own list.
- Which accounts are researching topics relevant to your business.
- Whether interest around a topic appears to be increasing.
- Which subjects or problems appear most relevant to an account.
- Which accounts may deserve more marketing or sales attention.
- How an account's research activity compares with normal behavior.
Read that list closely and none of the five is a purchase. Four are statements about reading, and one is a suggestion about where to put attention.
Where the Signal Actually Comes From
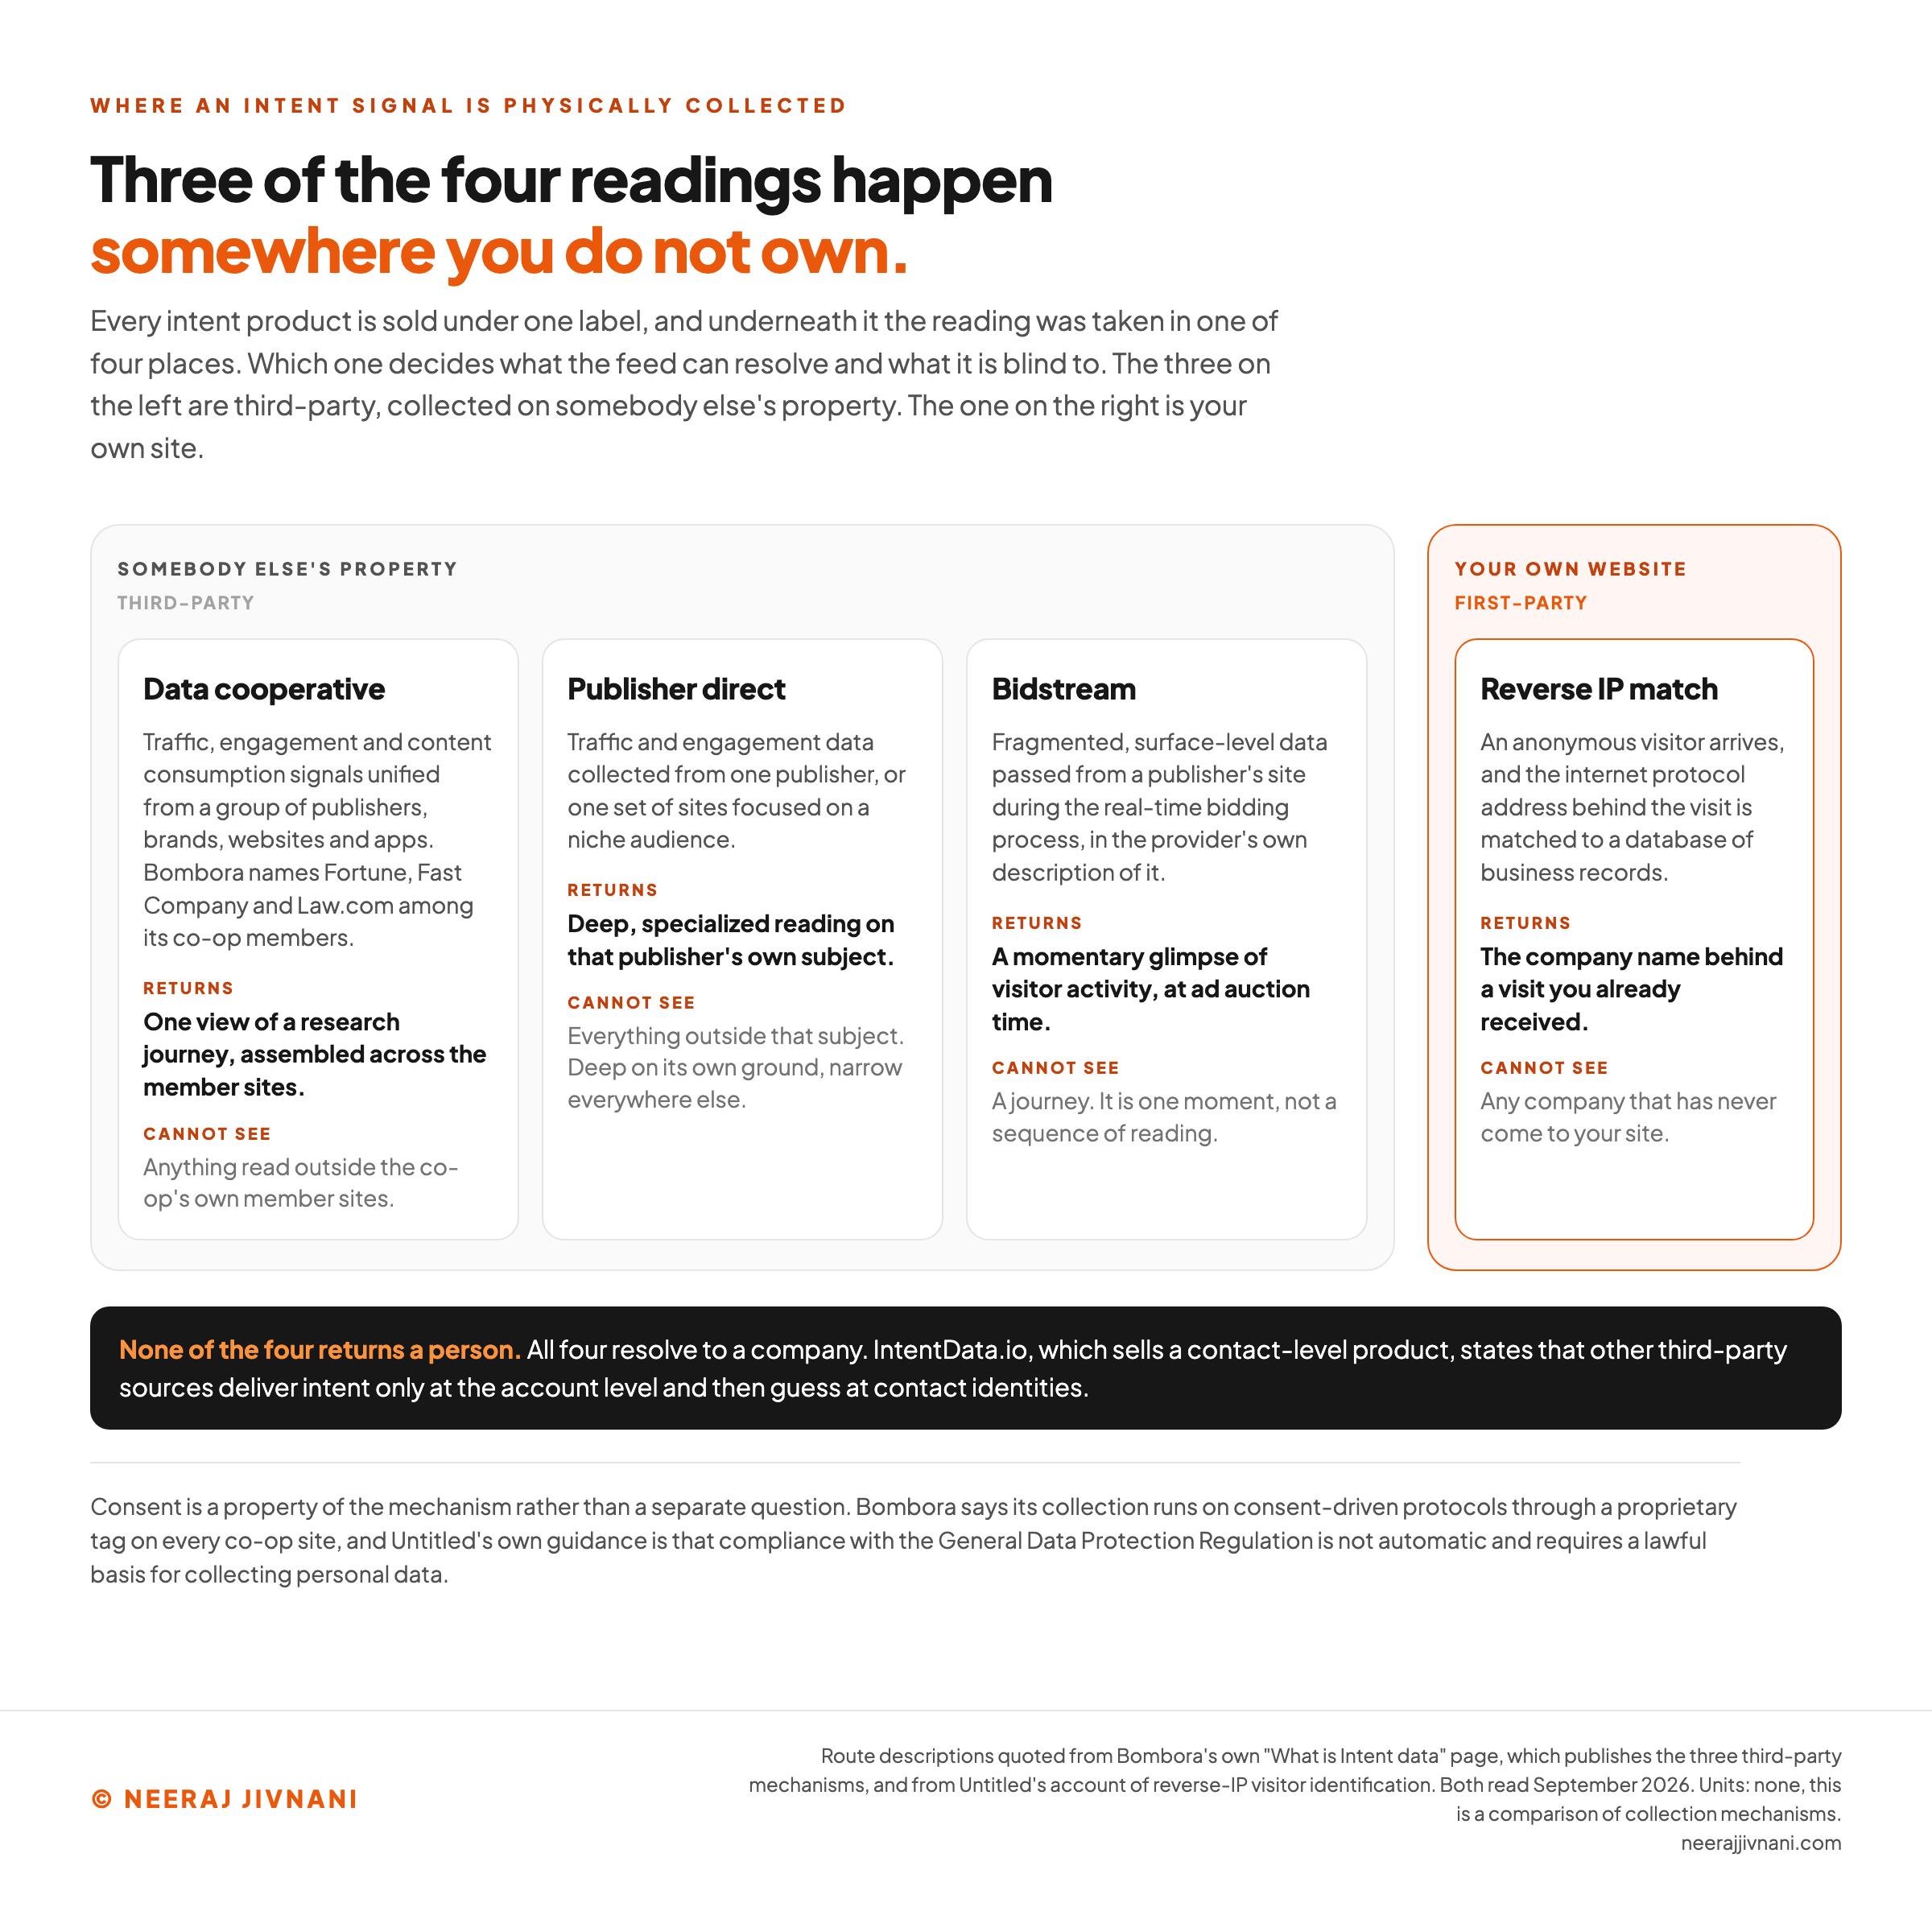
The signal comes from four places, and which one your feed uses decides what it can and cannot resolve. Three of the four are third-party, meaning the reading happened somewhere you do not own.
- A data cooperative. Traffic and content-consumption signals pooled from a group of publishers, brands, websites and apps into one view of a research journey. Fortune, Fast Company and Law.com are among the members of Bombora's co-op.
- Publisher direct. Traffic and engagement data collected from one publisher or set of sites focused on a niche audience. Deep on its subject, and narrow everywhere else.
- Bidstream. The advertising auction itself. When a page loads an ad slot, information about the visitor and the available inventory is broadcast to bidders, and somebody keeps it. It is fragmented and surface-level, a momentary glimpse of visitor activity in Bombora's words, and a glimpse is not a journey, which is exactly the contrast a co-op seller wants you to draw.
The fourth route is your own website, and it is first-party. When an anonymous visitor arrives, a provider matches the internet protocol (IP) address behind the visit to a database of business records and returns the company name.
The technique is called reverse IP tracking, and Lead Forensics is one of the products built on it.
Consent is a property of the mechanism rather than a separate subject. A co-op collects through its own tag on member sites, and Bombora says its collection is governed by consent-driven protocols.
Compliance with the General Data Protection Regulation (GDPR) does not come with the product. The regulation requires a lawful basis for collecting personal data, and it is normally the provider that has to hold one, so ask which basis before you buy.
There is a second question underneath all four, and it decides how useful the feed is on a Monday morning.
Does the signal resolve to an account or to a person?
Third-party feeds mostly resolve to an account and not to a person, and then guess at who inside the company it was. That is IntentData.io's complaint about its rivals, and it is a fair one.
The practical cost is that you cannot tell who is showing the interest, so the targeting widens to the whole company. That is not a reason to avoid account-level data. It is a reason to know which one you are buying, because the two answer different questions and cost different money.
What a Surge Measures, and What It Is Measured Against
A surge is a calculation, not a mood.
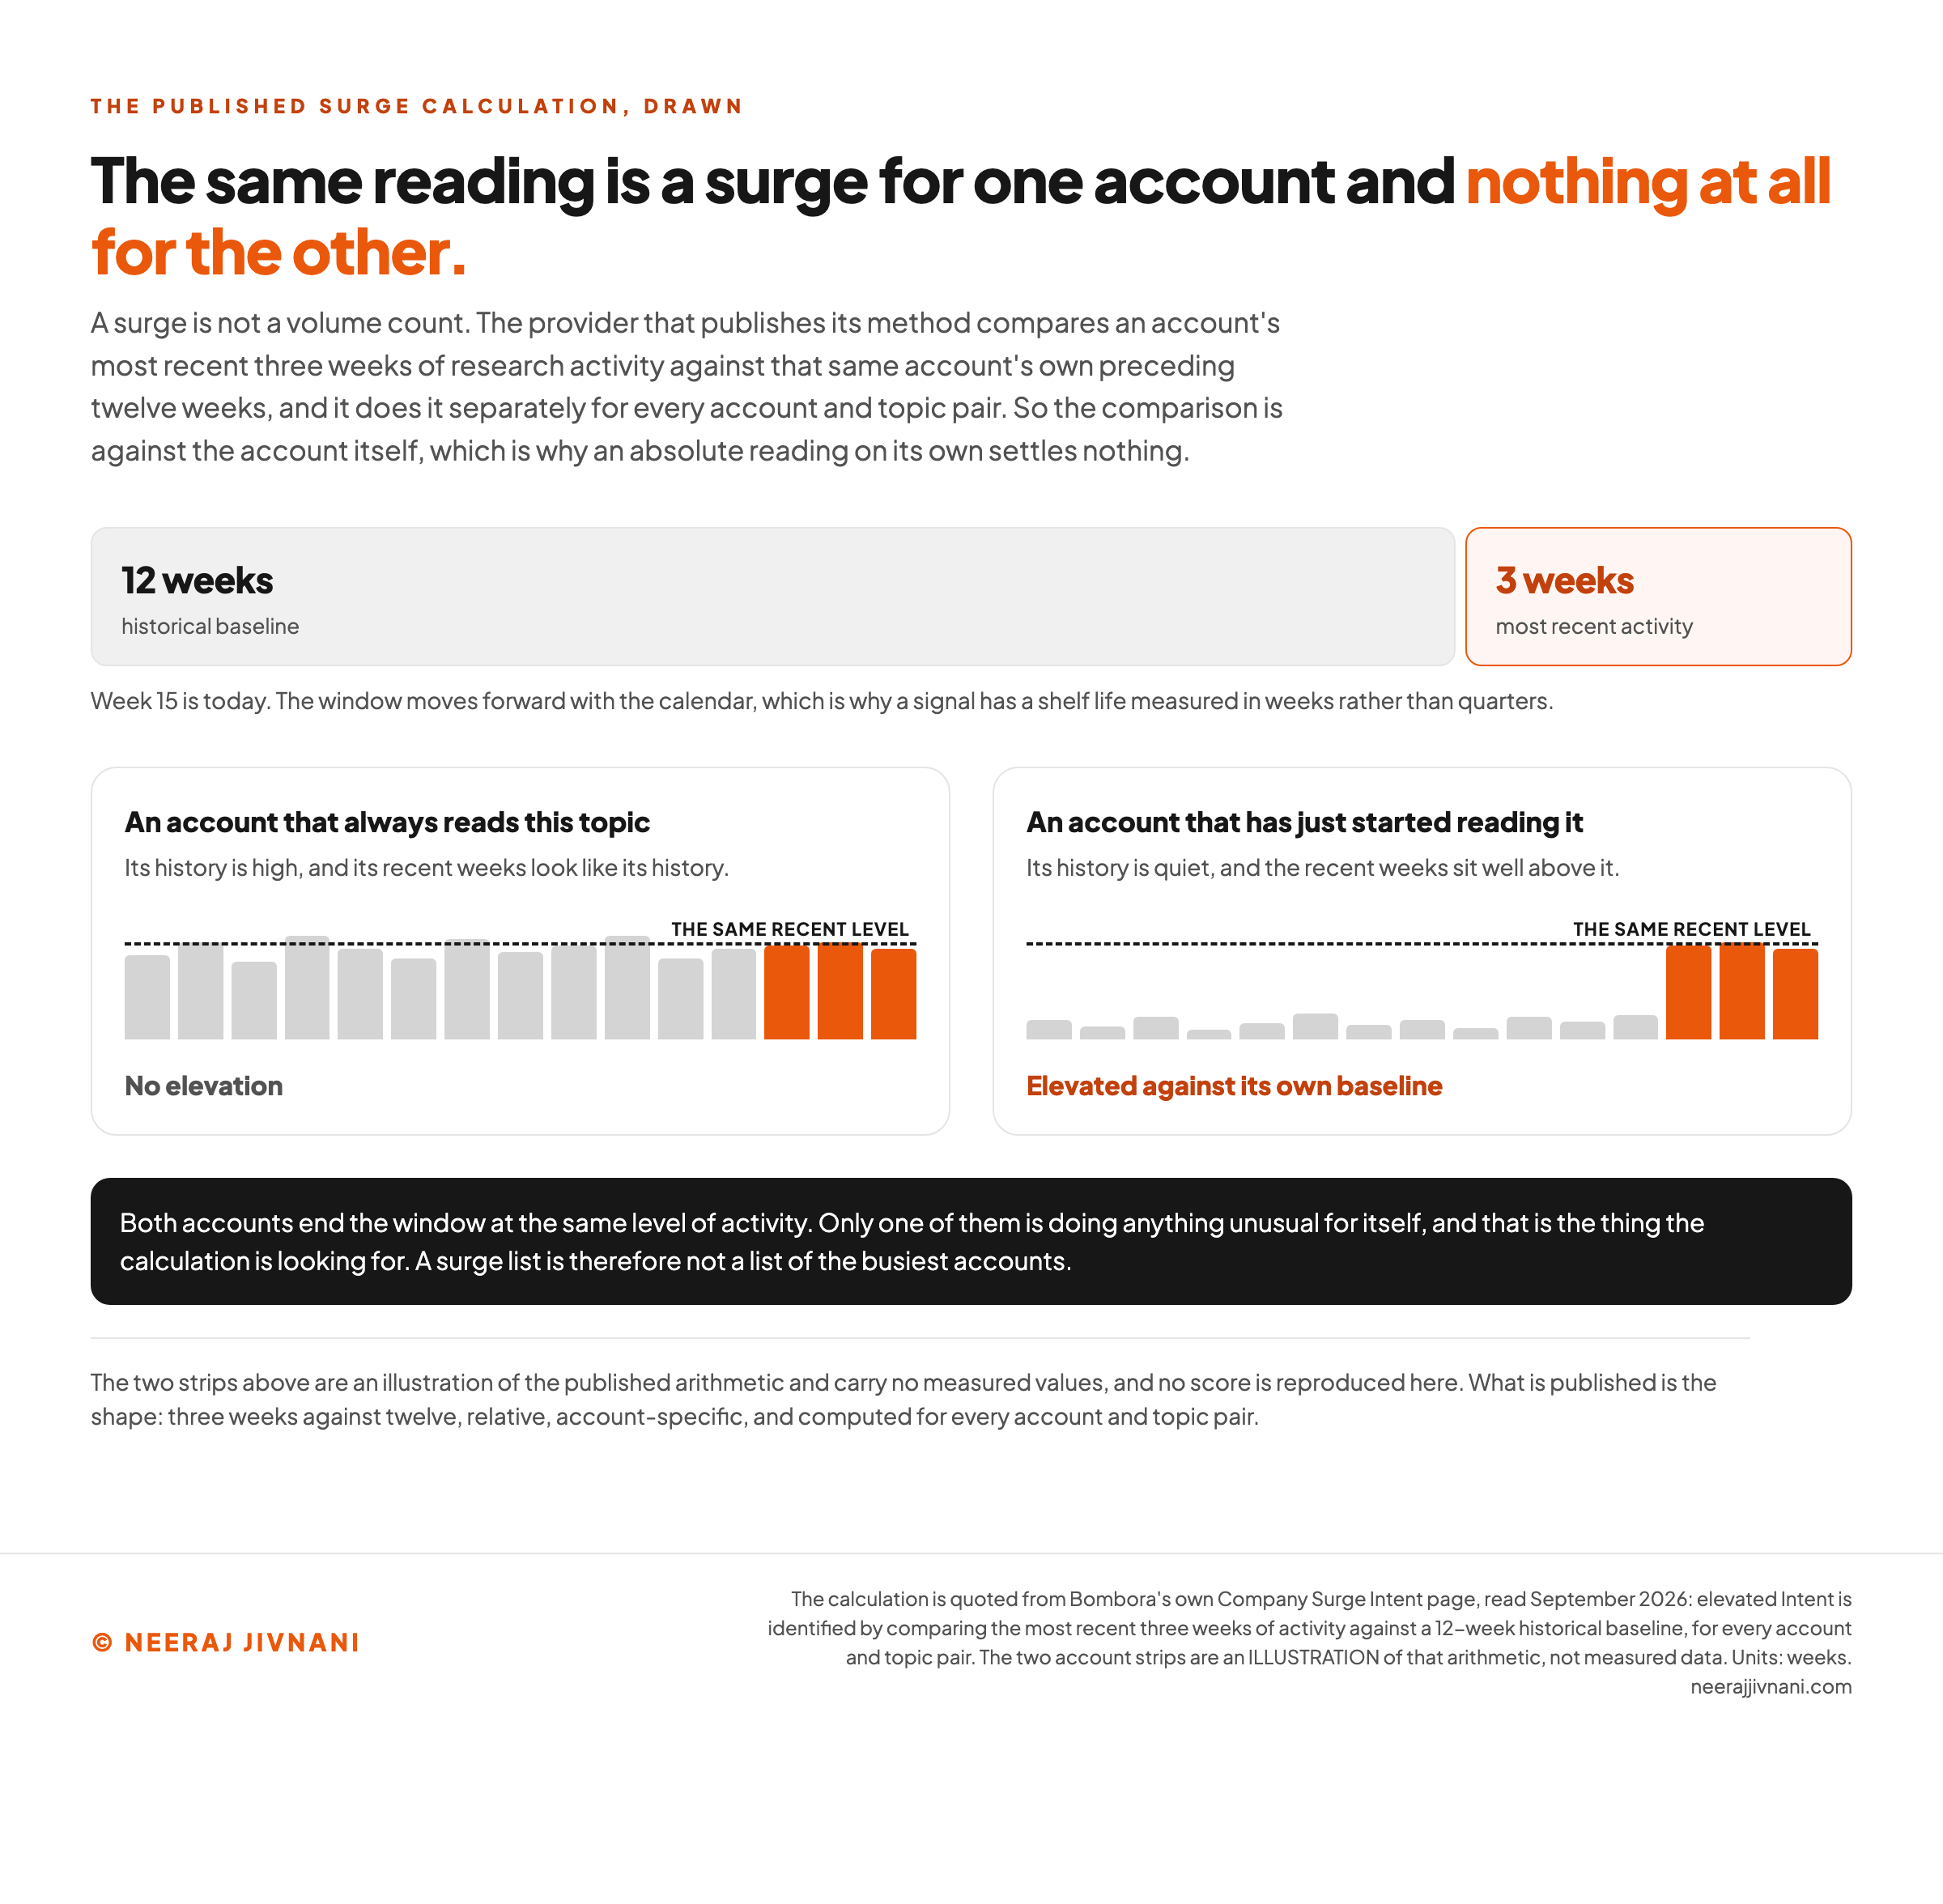
It compares an account's most recent three weeks of activity against that same account's own 12-week historical baseline, for every account and topic pair. Bombora publishes both that method and the count it runs across, 21,600+ topics.
Two things follow from that shape.
The comparison is relative to the account itself. A large company that always reads about a topic does not surge on it, and a small one that starts reading does, so a surge list is not a list of the busiest accounts.
And the window has a length. Three weeks of activity against twelve weeks of history gives a signal a shelf life measured in weeks rather than quarters.
What a spike algorithm typically weighs is a short list: the amount of content consumed, the number of consumers, the types of content, time on page and scroll speed. That is ZoomInfo's account of the inputs.
Underneath sits language processing. The models read what the research was about, and Bombora layers them with scroll velocity and time-on-page from its own tag, naming natural language processing and named entity recognition specifically.
Three weeks against twelve, on your own accounts
Put a few accounts in and the comparison above runs on them: each account's most recent three weeks against that same account's preceding twelve. Count whatever you can count, pages, sessions, documents, as long as both boxes hold the same thing.
| The account | Previous 12 weeks | Most recent 3 weeks | Baseline, per week | Recent, per week | Against its own baseline |
|---|---|---|---|---|---|
| 80 | 82 | +2.5% | |||
| 30 | 28 | -6.7% | |||
| 4 | 18 | +350.0% |
The two windows are different lengths, so each total is divided by its own number of weeks before anything is compared. The calculation runs for every account and topic pair, so everything here is one topic. Empty both boxes on a row to leave it out.
Ordered by how much they read
- 1Always reads this topic246
- 2Steady all quarter84
- 3Just started reading54
The three-week total, largest first. This is the list a volume count hands you.
Ordered against each account's own baseline
- 1Just started reading (number 3 by volume)+350.0%
- 2Always reads this topic (number 1 by volume)+2.5%
- 3Steady all quarter (number 2 by volume)-6.7%
The same accounts, each one read against its own preceding twelve weeks.
Always reads this topic reads the most, and Just started reading is the one that has moved. Ranked by how much they read, Always reads this topic is first. Ranked against its own preceding twelve weeks it is number 2, above its own baseline at +2.5%. The same numbers, two different lists.
The comparison is relative to the account itself, which is why a surge list is not a list of the busiest accounts.
Seeded with an illustration rather than measured data, and no row here is a real company. Every figure is arithmetic on the boxes: each window total divided by the weeks in that window, then the recent rate against the baseline rate. The two per-week columns are rounded for display and the comparison uses the totals you typed, so on very small numbers the two will not multiply back exactly. Nothing is scored and no cutoff is applied, because what the section above publishes is the comparison.
Where ZoomInfo's Intent Data Comes From
ZoomInfo does not publish where its third-party intent comes from, and that is the honest answer to a question a lot of buyers ask.
What it does say is that third-party signals are gathered from publisher networks, review sites such as G2 and TrustRadius, and content syndication platforms. No supplier is named, no collection route is given, and the word bidstream appears nowhere on ZoomInfo's page.
There is also a declared route rather than an inferred one: ZoomInfo surveys millions of business professionals who are incentivized to share their priorities, projects and pain points. Declared intent is a different product from observed reading, and worth keeping separate in your head.
The most specific public statement about the third-party half comes from a competitor. ZoomInfo is believed to rely on bidstream data and machine learning, in Cognism's provider comparison.
Believed to is a hedge, and a hedge from a rival is not a specification.
Use this chart — embed code and citation
<a href="https://neerajjivnani.com/blog/intent-data/"><img src="https://neerajjivnani.com/infographics/intent-data/collection-routes.png" alt="The four places an intent signal is collected, compared side by side: a data cooperative pooling publisher and brand sites, a single publisher's own network, the real-time bidding stream behind online advertising, and reverse-IP matching on your own website, with the resolution each one returns and what each one cannot see." width="1200"></a>
<p>Chart: <a href="https://neerajjivnani.com/blog/intent-data/">Neeraj Jivnani</a></p>Neeraj Jivnani, "Intent Data: Where the Signal Comes From, and What It Can Tell You", neerajjivnani.com, https://neerajjivnani.com/blog/intent-data/Free to republish with a link back to this page.
Use this chart — embed code and citation
<a href="https://neerajjivnani.com/blog/intent-data/"><img src="https://neerajjivnani.com/infographics/intent-data/surge-window.png" alt="The published surge calculation drawn as a timeline: an account's most recent three weeks of research activity compared against its own preceding 12-week historical baseline, computed separately for every account and topic pair, with the same absolute reading producing a surge for one account and nothing for another." width="1200"></a>
<p>Chart: <a href="https://neerajjivnani.com/blog/intent-data/">Neeraj Jivnani</a></p>Neeraj Jivnani, "Intent Data: Where the Signal Comes From, and What It Can Tell You", neerajjivnani.com, https://neerajjivnani.com/blog/intent-data/Free to republish with a link back to this page.
First-Party, Second-Party and Third-Party
The three party labels describe who did the collecting, and each one buys something the others cannot.
First-party is what you collect on your own properties: website activity, content downloads, webinar engagement, product interactions and email engagement. It is the highest-quality intent you can hold, because the buyer submitted it directly, and it covers only the people already engaging with you.
Second-party is somebody else's first-party data, bought from them directly through a data partnership. In business software the main sellers are review platforms, and G2 and TrustRadius sell it alongside their listings.
Third-party is collected across the open web by an aggregator and sold as a product. It reaches accounts that have never visited you, which is its whole appeal, and it carries trade-offs the other two do not.
Underneath the party labels are the signal families themselves. There are two: search intent, where somebody types a query into a search engine, and engagement data, where they interact with content. Either can appear inside any of the three parties, depending on who owns the property.
Firmographic and Technographic Data Are Not Intent
Firmographic and technographic data are filed alongside intent data on vendor pages, and neither one contains any behavior.
Cognism lists both among its four types of intent data source, and Boomi puts them under other sources of buyer intent. That is how they end up on the same quote as your feed.
Here is what each one holds.
- Firmographic data is size, location, industry and revenue, gathered from business directories, website forms and data providers.
- Technographic data is the software, hardware and networks a company runs, often collected by surveys, questionnaires and polls.
Nobody browsed anything to produce either one. They describe what a company is and what it owns, which is a standing condition rather than a change in behavior.
The distinction is worth holding because the two data types answer different questions. Firmographic and technographic data tell you who is worth selling to, and intent data is supposed to tell you when.
The vendors themselves use them exactly that way.
Intent is often paired with firmographic and technographic data to narrow a list to accounts that are high-fit, which is how ZoomInfo describes the practice, and Demandbase adds CRM, engagement and buying-group data to the same combination.
Buying a technographic feed and expecting timing out of it is buying the wrong product. It will tell you every company running a competitor's software, and nothing at all about which of them is looking to change.
What the Published Numbers Do and Do Not Say
One provider's feed sits underneath several of the products on sale, and its specification is published in five different versions.
It reaches buyers through several different logos: Factors.ai's own comparison table names Bombora as the third-party source behind Factors.ai, SMARTe, Cognism and 6sense.
Here is what a buyer gets quoted for that feed's topic count and its exclusivity, alongside the provider's own figures.
| who publishes it | intent topics | exclusivity claim | co-op size |
|---|---|---|---|
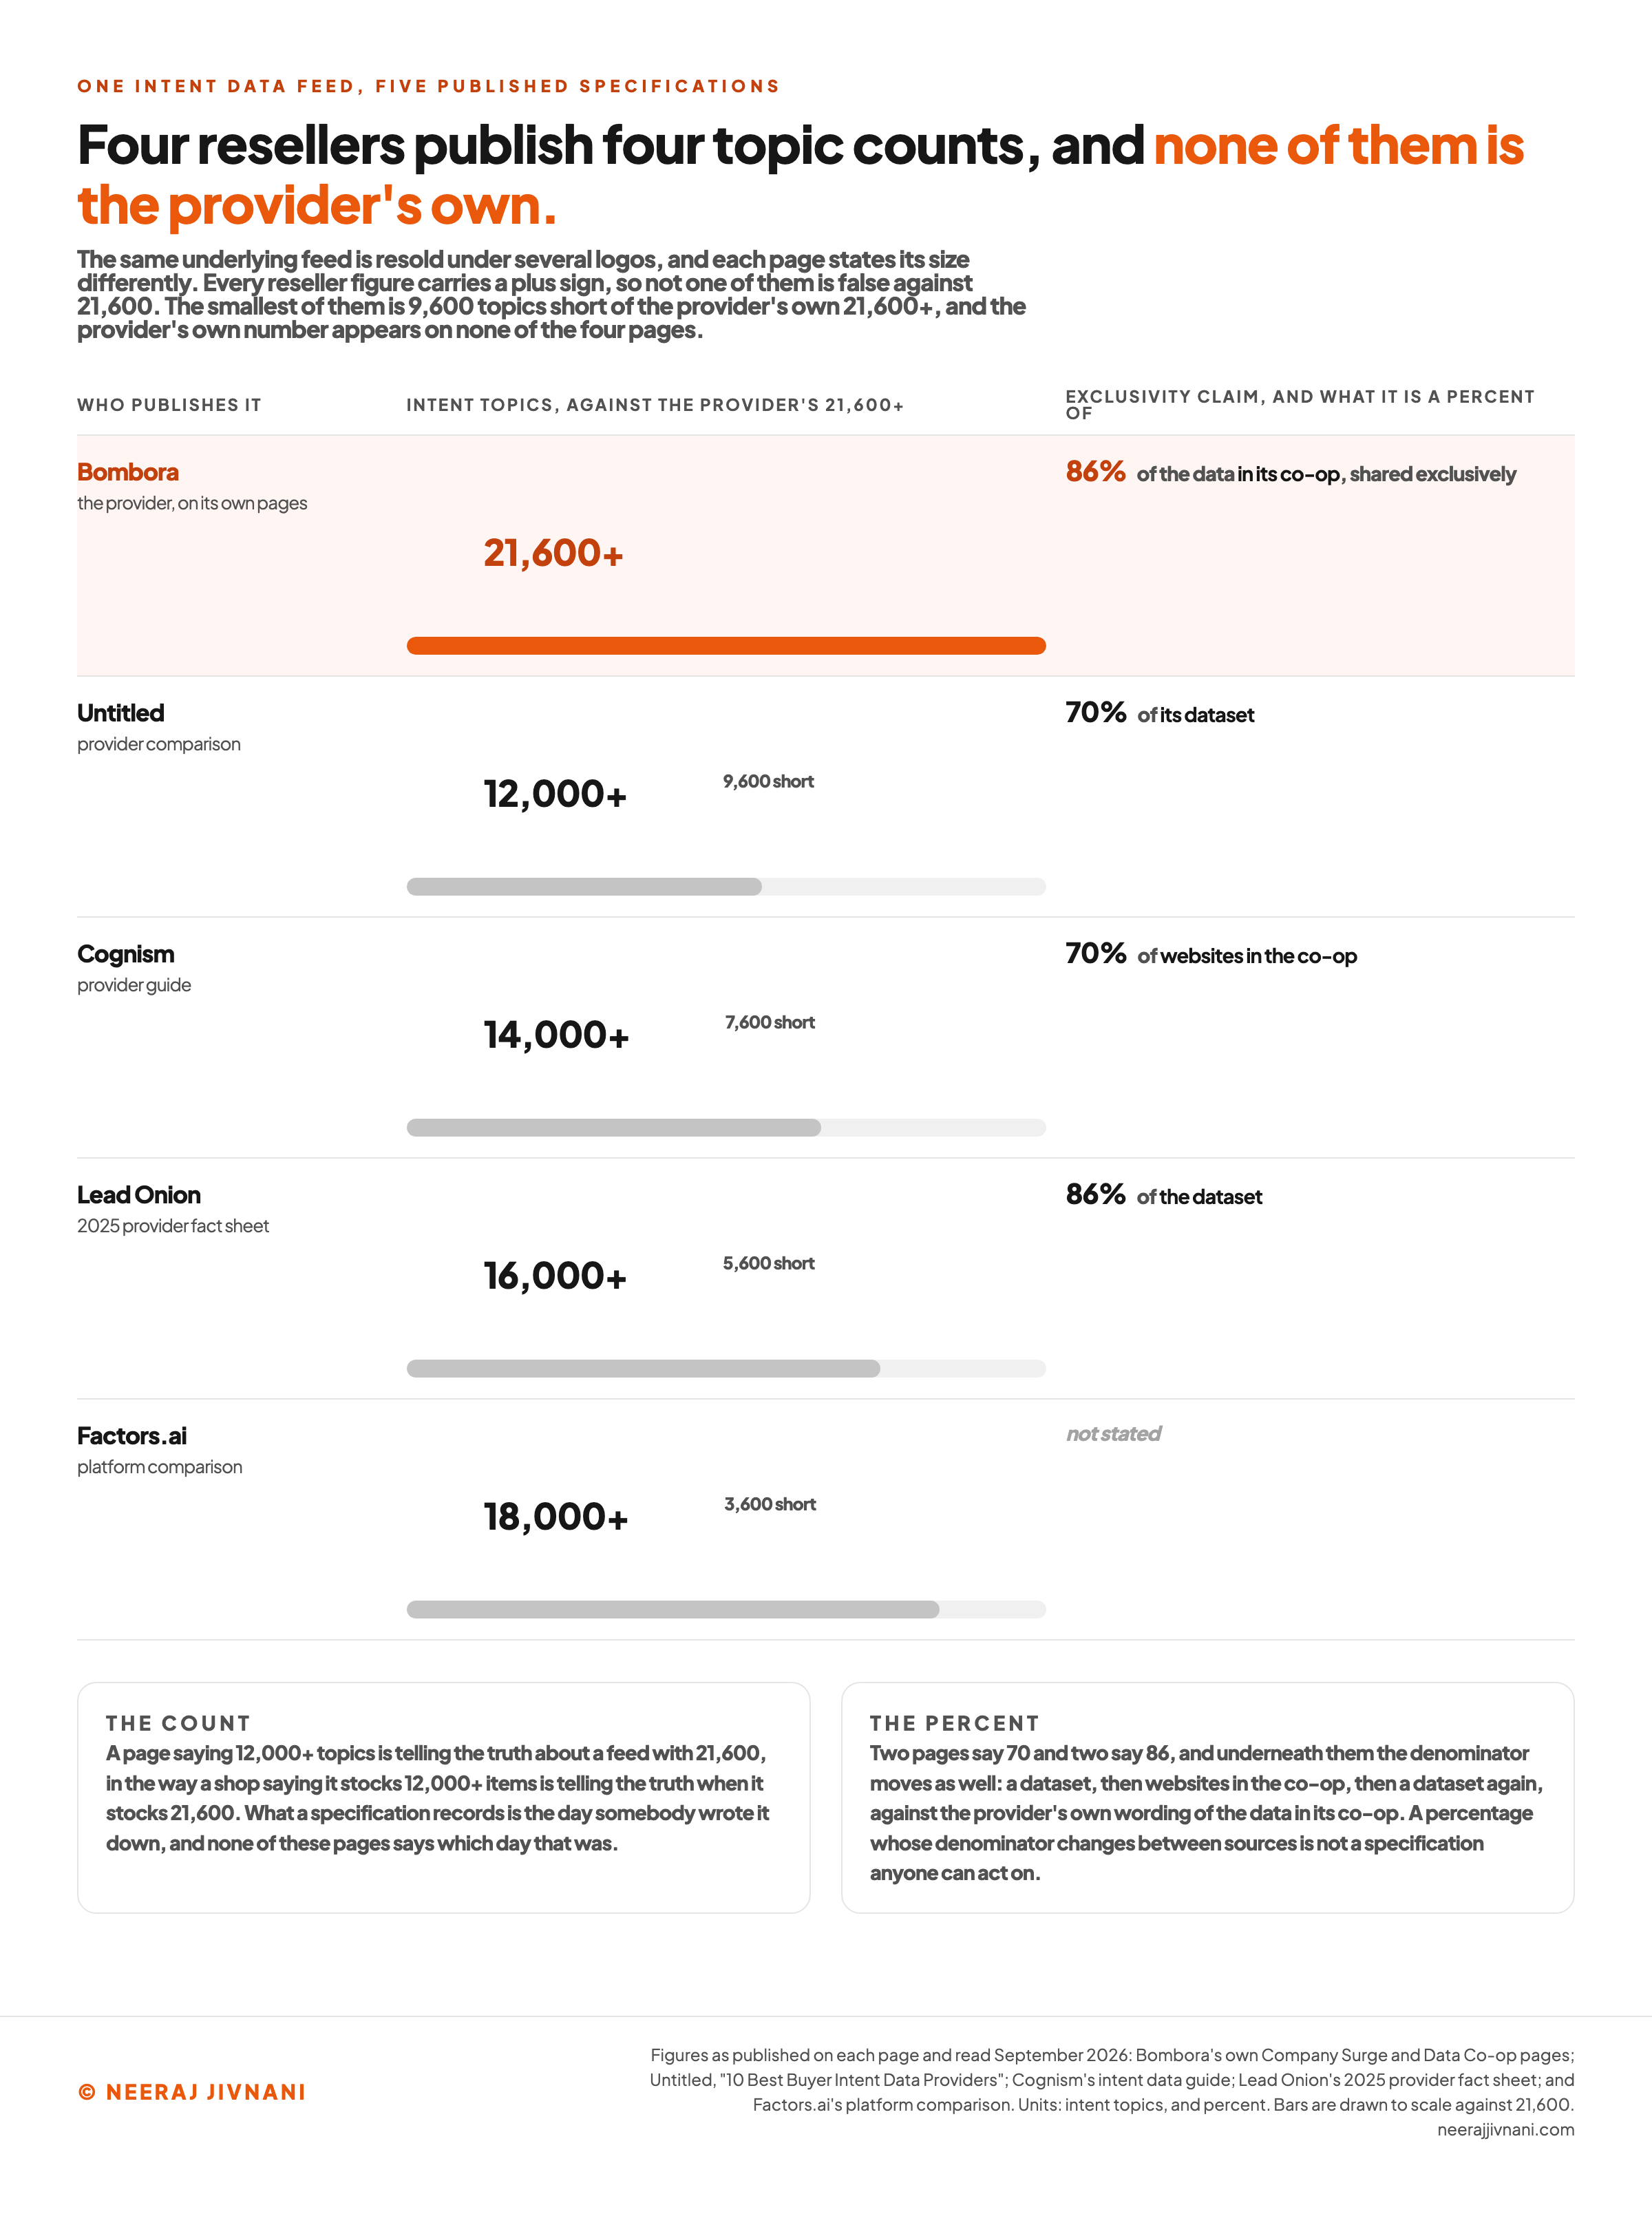
| Bombora, its own Company Surge and Data Co-op pages | 21,600+ | 86% of the data in its co-op, shared exclusively | thousands of B2B media sites, 1,765+ added in two years |
| Untitled, provider comparison | 12,000+ | 70% of its dataset is exclusive | 5,000+ B2B websites |
| Cognism, provider guide | 14,000+ | 70% of websites in the co-op are exclusive | 5,000 B2B sites |
| Lead Onion, 2025 provider fact sheet | 16,000+ | 86% of the dataset is unique | 5,000+ B2B sites |
| Factors.ai, platform comparison | 18,000+ | not stated | 5,000+ premium B2B publisher sites |
The Topic Count, in Five Published Versions
Every reseller figure carries a plus sign, so none of them is false against 21,600.
A page saying 12,000+ topics is telling the truth about a feed with 21,600, in the way a shop saying it stocks 12,000+ items is telling the truth when it stocks 21,600.
A buyer who sizes the feed off the smaller figure still gets it wrong. And the provider's own number appears on none of the four pages.
What a spec sheet records is the day somebody wrote it down. Nothing on these pages says which day that was.
The Exclusivity Claim Carries Three Denominators
The exclusivity figure is the messier one, because the percentage moves and so does what it is a percentage of.
Three of the four resellers state a figure: two say 70% and one says 86%, against the provider's own 86%.
The denominator moves as well, from a dataset to websites in the co-op and back to a dataset, against the provider's wording of the data in its co-op. Those are not the same measurement. A percentage whose denominator changes between sources is not a specification anyone can act on.
The Figure They Agree On Is Not the Provider's
The number all four resellers agree on is the co-op size, 5,000 sites.
That figure is on none of the three Bombora pages that describe the co-op. Read in September 2026, those pages say hundreds of publishers and brands and thousands of B2B media sites, and that 1,765+ new sites were added over the last two years.
When a specification matters to a decision, take it from the provider's own page and write down the date you read it, because a reseller's spec sheet is a photograph of whenever it was written.
Use this chart — embed code and citation
<a href="https://neerajjivnani.com/blog/intent-data/"><img src="https://neerajjivnani.com/infographics/intent-data/published-specs.png" alt="Five published specifications for one intent data feed set side by side, showing topic counts of 12,000 plus, 14,000 plus, 16,000 plus and 18,000 plus from four reseller pages against the provider's own 21,600 plus, and the exclusivity claim splitting between 70 percent and 86 percent across three different denominators." width="1200"></a>
<p>Chart: <a href="https://neerajjivnani.com/blog/intent-data/">Neeraj Jivnani</a></p>Neeraj Jivnani, "Intent Data: Where the Signal Comes From, and What It Can Tell You", neerajjivnani.com, https://neerajjivnani.com/blog/intent-data/Free to republish with a link back to this page.
What Intent Data Cannot Tell You
Intent data is not proof that anybody has decided to buy anything.
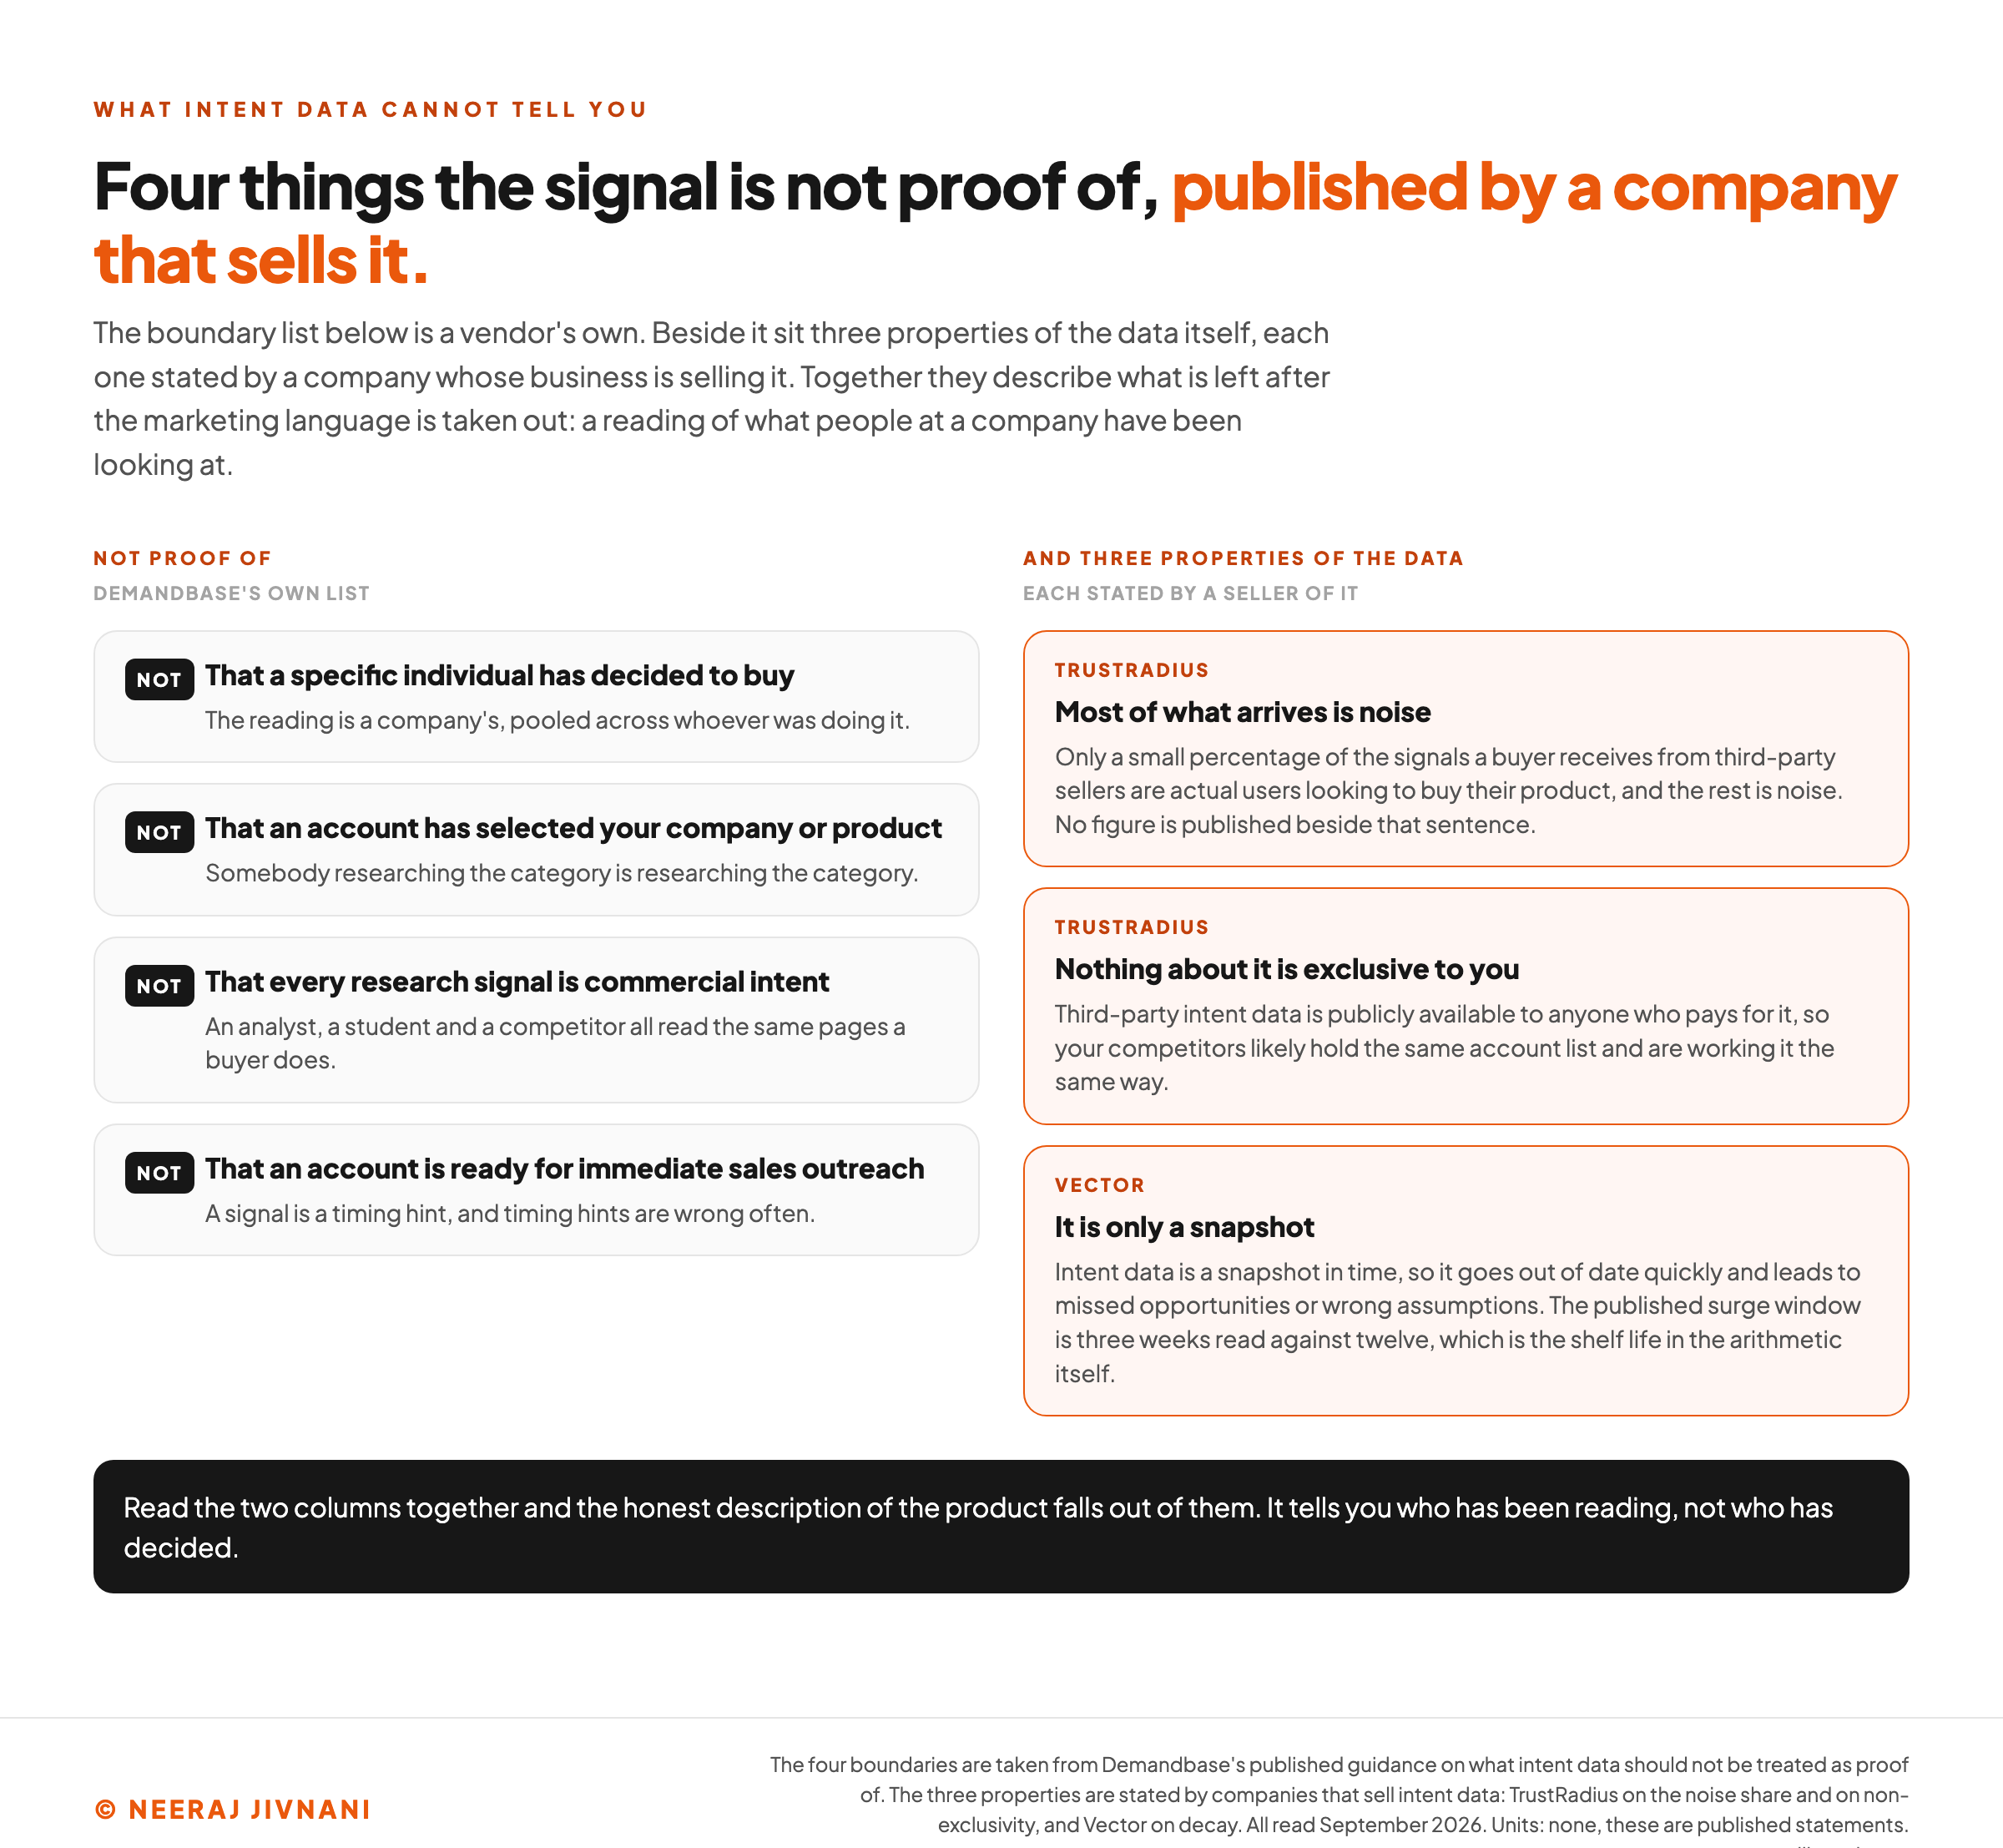
Four boundaries are worth holding on to when a surge score arrives, and Demandbase, which sells intent data, publishes them itself.
- That a specific individual has decided to buy. The reading is a company's, pooled across whoever was doing it.
- That an account has selected your company or product. Somebody researching the category is researching the category.
- That every research signal is commercial intent. An analyst, a student and a competitor all read the same pages a buyer does.
- That an account is ready for immediate sales outreach. A signal is a timing hint, and timing hints are wrong often.
Three Properties of the Data Itself
Underneath those four boundaries sit three properties of the data, and each one is stated by a company that sells it.
Most of what arrives is noise. Only a small percentage of the signals a buyer receives from third-party sellers are actual users looking to buy their product, and TrustRadius, which sells the second-party alternative, is the one saying so.
TrustRadius does not quantify the share, so plan on a hit rate you cannot see in advance.
Nothing about a third-party feed is exclusive to you. It is publicly available to anyone who pays, so your competitors likely hold the same account list and are working it the same way, which is TrustRadius's point about the category it competes with.
And it decays. A feed is a snapshot in time that goes out of date quickly, leading to missed opportunities or wrong assumptions, which Vector names as a pitfall of the thing it sells.
Whether It Works, and What a Performance Number Is Worth
Performance claims in this category come from the vendor whose product they describe, and they arrive without denominators.
The answers arrive in adjectives. Dreamdata's is a clear lift in metrics, and more leads, engagement, clicks and conversions, with no figure behind any of it.
Where a figure does appear it comes without a sample. Untitled credits its own product with a 37% reduction in cost per lead and a return on ad spend of four to eight times, and publishes nothing behind either.
So the working assumption for any performance number quoted at you is that it has no denominator until somebody shows you one. Ask how many accounts, over what period, measured against what.
Use this chart — embed code and citation
<a href="https://neerajjivnani.com/blog/intent-data/"><img src="https://neerajjivnani.com/infographics/intent-data/what-it-cannot-say.png" alt="The four things a published vendor boundary list says intent data is not proof of, set against the three properties of the data that limit it, showing that a signal is not evidence a person decided to buy, that an account chose you, that every research signal is commercial, or that an account is ready for outreach, alongside the noise share, the non-exclusivity and the decay." width="1200"></a>
<p>Chart: <a href="https://neerajjivnani.com/blog/intent-data/">Neeraj Jivnani</a></p>Neeraj Jivnani, "Intent Data: Where the Signal Comes From, and What It Can Tell You", neerajjivnani.com, https://neerajjivnani.com/blog/intent-data/Free to republish with a link back to this page.
Who Sells It, and How to Judge One
The same names recur across the provider lists in this category: Bombora, ZoomInfo, 6sense, Demandbase, Cognism, G2, TrustRadius, Lead Forensics and Factors.ai. Ranking them is a different job from this one, and who sells a product matters less than one structural fact about the list.
Several of them resell the same underlying feed.
Cognism's own page says it gets its intent data from Bombora, and it is not the only name on that list doing so.
So three of those nine are reselling one signal, and choosing between them is choosing an interface rather than a feed.
What Actually Separates One Provider From Another
Four criteria separate providers better than a feature list does.
- Data freshness. How often the feed refreshes. If it is not often enough, the moment the account came into market has already passed.
- Breadth and depth of signals. How many kinds of buying signal the provider offers, since combining intent topics with other signals beats relying on one.
- Flexibility of topics. How easily you can change what you are watching, so the feed follows the way your buyers research.
- Display inside the workflow. Whether signals appear in the tools your team already works in, rather than arriving as a file somebody has to upload.
A fifth criterion belongs beside them, because it decides what the other four are describing. Ask which of the four collection routes each topic's signal comes from, and whether the feed resolves to an account or to a person.
That question separates two products that look identical on a pricing page. A bidstream feed and a co-op feed are both third-party intent, and they are not the same purchase.
Putting a Signal to Work
Putting the feed to work splits along the two teams that read it, and they want different things from the same file.
The common thread is that a signal changes the order of a list and the timing of a message, and does not change what is being sold.
What Each Team Takes From the Same File
Marketing uses it to decide where budget goes.
Prioritize the accounts and contacts showing active intent, set channel mix and personalization depth by intent tier, and match the asset to the topic behind the signal.
Sales uses the same file for order and context.
Work the strongest signals first, build a structured follow-up rather than a single touch, and treat a customer's sudden competitor research as an early warning of churn.
Both teams feed the same scoring model. Weight the score with intent so the accounts already in motion move up, and keep that weight small enough that fit still decides who is worth selling to at all.
For an account-based program the role is narrow and worth stating narrowly. Intent tells the program which accounts are in market this quarter.
Everything after that, the committee mapping, the tiering and the spend per account, is a separate piece of work the signal does not do.
The Failure Mode, and What to Measure
The temptation is to send the email that says you were seen looking at the website, because the signal feels like proof you were paying attention.
That is the biggest mistake teams make with a feed. Sending it turns a timing advantage into a privacy complaint, and creepy is Factors.ai's word for the email.
Use the signal as timing cover instead. Send the case study or the checklist that addresses the problem the account was researching, and do not mention the tracking.
Measuring whether any of it worked gets one short list: conversion rates on leads tied to high-intent signals, deal velocity, pipeline influence, win rates, how much intent shifts the lead score, and which content and channels engage high-intent prospects.
What to Settle Before You Buy Any of It
Four things settle whether a feed will do anything for you, and all four are answerable before money moves.
Get the provenance in writing. A co-op, a single publisher, the bidding stream and a reverse-IP match on your own site are four different products behind one label, and a rival's hedge is not an answer to which one you are buying.
Ask what the score is relative to, and over what window. A surge compared against an account's own baseline behaves nothing like a raw volume count, and a three-week reading against a 12-week history tells you the signal expires.
Ask whether the signal resolves to an account or to a person, and price the difference honestly: an account-level list still needs somebody to work out who inside the company to contact.
Then take the specification from the provider's own page, and note the date you read it.
Which leaves the expectation itself. The feed tells you who has been reading, not who has decided, and every use of it that works treats it as an ordering rule rather than an answer.