The Category Development Index, and What a Score Above 100 Is Worth
How to calculate it, what a score above or below 100 tells you, and how far from 100 a market has to sit before the number means anything.

/ On this page10 sections
The category development index, or CDI, tells you whether one place, or one group of people, buys a whole product category harder than the country does.
It compares the category's share of sales in one place with that place's share of the people, and scales the answer so that 100 is average.
Reading it is where care is owed. A wide band around 100 counts as ordinary, and a high score is evidence of appetite rather than of opportunity.
What the Category Development Index Measures
The category development index measures how strongly a whole product category sells in one segment, compared with how strongly it sells across the whole market that segment sits inside, with the segment's size taken out of the comparison.
That construction is the one the Marketing Accountability Standards Board's dictionary carries, referenced there to Farris, Bendle, Pfeifer and Reibstein's Marketing Metrics, 2010.
Two words in that definition are doing the work.
Category means the product class, never your brand. Soft drinks rather than your soft drink, pet food rather than your pet food.
Segment is whatever you are holding up for comparison: a metro area, a census division, an age band, one retailer's shoppers.
Geography is the usual cut, because sales data tends to arrive that way.
From here on a segment being indexed is called a market, because that is the word the data and the sources use for it.
Why the Size of the Market Gets Divided Out
Removing size from the comparison is what the index is for.
Texas buys more of nearly everything than Vermont does, and most of that difference is population.
A ranked list of sales by market tells you where your volume sits. It cannot tell you where the category is unusually welcome.
The index answers that second question by putting sales and people on the same footing before anything is compared.
How to Calculate a Category Development Index
Divide the market's share of total category sales by the market's share of the base population, then multiply by 100.
CDI = (market's % of total category sales / market's % of total population) x 100
Say a snack category sells 100 million units a year across a country of 300 million people, and one metro area holds 3% of those people and 4.5% of those units.
None of those figures is measured. They are round numbers, picked so you can follow every step without a calculator.
4.5 / 3 = 1.5, and 1.5 x 100 gives a category development index of 150.
The same answer arrives from the other direction, which is worth seeing once because it shows what the index is made of.
That metro buys 4.5 million units among 9 million people, or 0.5 units a head. The country buys 100 million among 300 million, or 0.333 a head.
Divide one rate by the other and you get 1.5 again.
So the index is a ratio of two consumption rates. People here buy the category half as much again as the average person does.
What Each Input Has to Be
Four conditions decide whether the number means anything, and all four are about matching the two halves rather than about the arithmetic.
- The same period on both halves. A quarter of sales against an annual population figure produces a number with no interpretation at all.
- The same geography on both halves. Retail data usually arrives cut into the vendor's own market definitions, and those rarely line up with a census boundary. Use one definition and say which.
- One unit throughout. Units or dollars, chosen once. A dollar share in a market where the category sells at a premium will read higher than the unit share, and that is a price effect rather than an appetite effect.
- A base that fits the buyer. People are the usual base and far from the only possible one. Households, customers, accounts and businesses all serve, and a category bought by firms belongs on a base of firms.
Express the result as a whole number. It keeps every score directly comparable with the base of 100 a reader is holding it against.
Where the Two Numbers Come From
Both numbers are obtainable without buying anything, and knowing where to look is usually what stands between a team and its first index.
Category sales by market is the one that takes work, because it means the whole category and not you alone. Three routes get you there.
- Syndicated retail measurement, if your company already subscribes. This is the cleanest source and the one most reporting is built on.
- A trade association's published category report. Commodity boards and industry associations publish market-level category data free, and some of them publish the index itself already calculated.
- Your own shipment or distributor data, which gives you your brand rather than the category. Put your own sales in the numerator and what comes back is the brand index under another name.
Population by market you can get today, from census data.
The one thing left to check is that the two halves describe the same universe of buyers. Retail measurement often covers grocery, mass, club and drug and leaves other channels out, so the sales half is a subset while the population half is everybody.
You can work with that, as long as the missing channels are missing everywhere. A level that is slightly low across the board still ranks the markets correctly.
Reading the Score
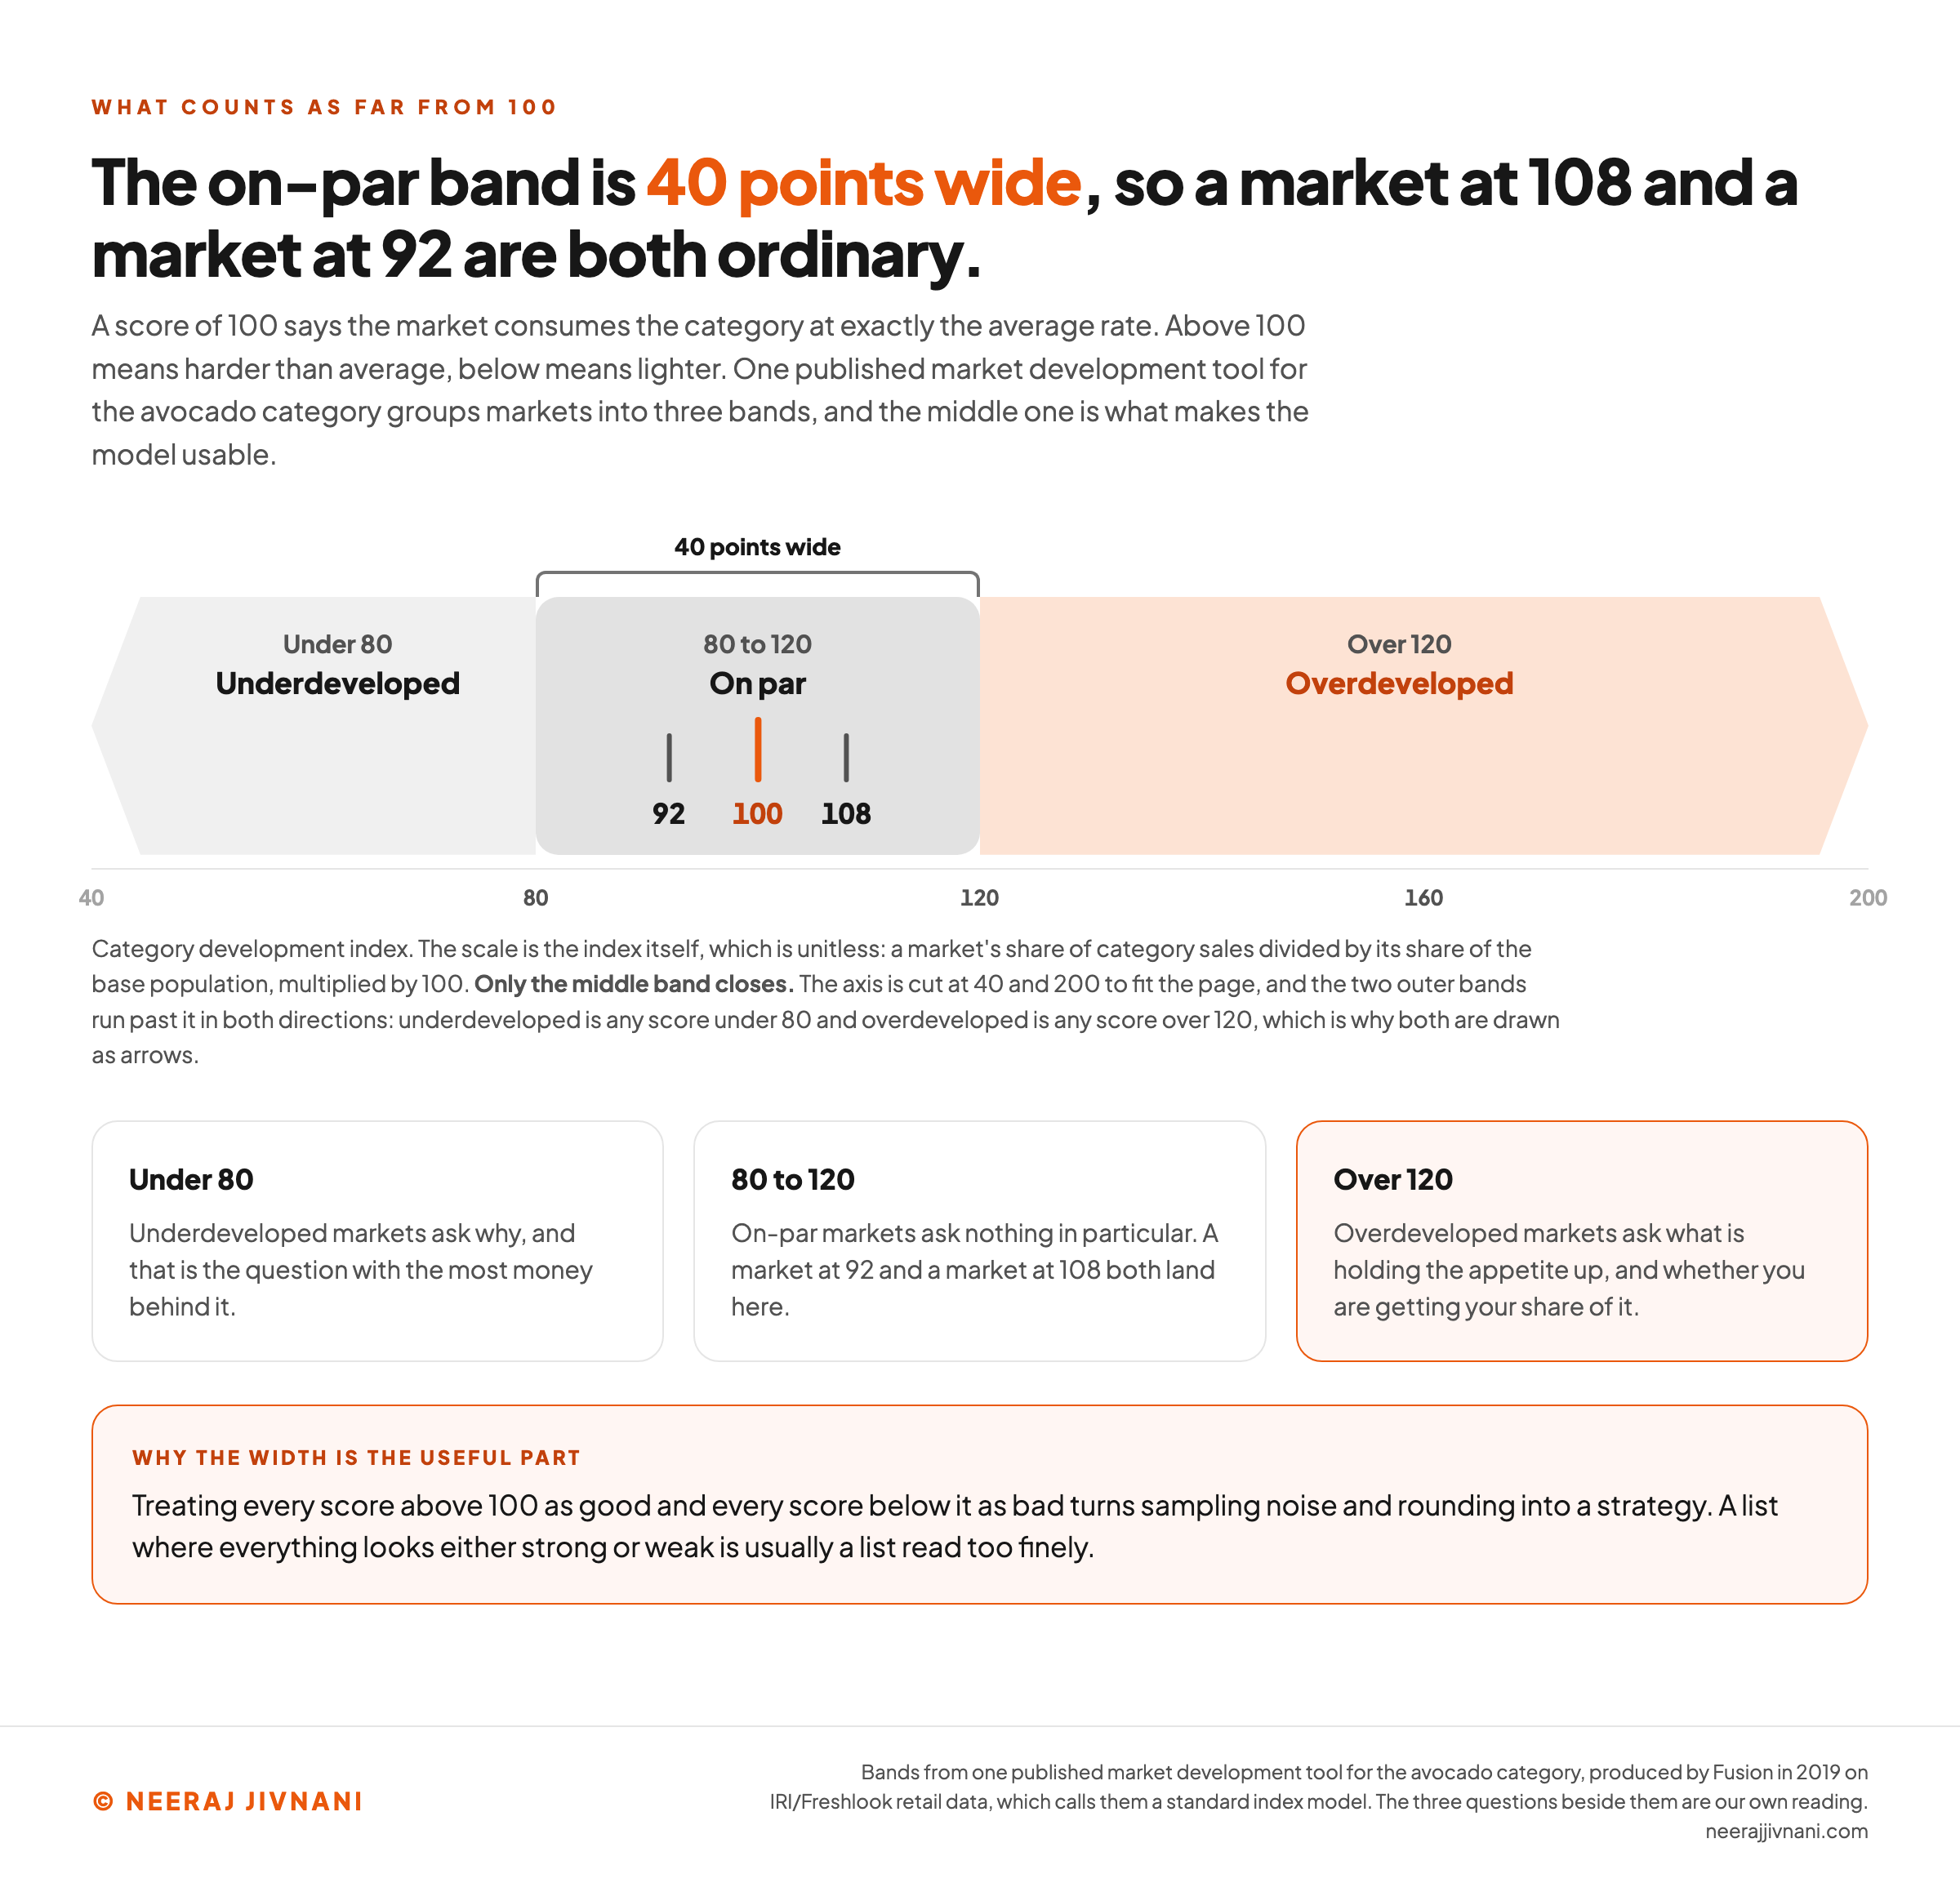
A score of 100 says the market consumes the category at exactly the average rate. Above 100 means harder than average, below means lighter.
What matters next is how far from 100 counts as far.
Over 120 is overdeveloped, 80 to 120 is on par, and under 80 is underdeveloped.
Those bands come from one published market development tool for the avocado category, produced by Fusion in 2019 on IRI/Freshlook retail data for the 52 weeks to the end of 2018, in what it calls a standard index model.
That middle band is what makes the model usable. It is 40 points wide, and it says that a market at 108 and a market at 92 are both ordinary.
Treating every score above 100 as good and every score below it as bad turns sampling noise and rounding into a strategy.
A list where everything looks either strong or weak is usually a list read too finely.
The three bands also imply three different questions rather than a ranking.
Overdeveloped markets ask what is holding the appetite up, and whether you are getting your share of it. On-par markets ask nothing in particular.
Underdeveloped markets ask why, and that is the question with the most money behind it.
Use this chart — embed code and citation
<a href="https://neerajjivnani.com/blog/category-development-index/"><img src="https://neerajjivnani.com/infographics/category-development-index/the-on-par-band.png" alt="A horizontal scale of the category development index, divided into three bands: under 80 underdeveloped, 80 to 120 on par, and over 120 overdeveloped. The on-par band is the only closed box, and a bracket above it reads 40 points wide; the two outer bands are drawn as arrows running off each end, because a score under 80 or over 120 has no far limit and the axis itself is cut at 40 and 200 to fit. Three markers sit inside the on-par band at 92, 100 and 108, showing that a market eight points above average and a market eight points below it fall in the same group. Three cards underneath give the question each band asks. Underdeveloped markets ask why, and that is the question with the most money behind it. On-par markets ask nothing in particular, and a market at 92 and a market at 108 both land there. Overdeveloped markets ask what is holding the appetite up, and whether you are getting your share of it. A band across the foot says treating every score above 100 as good and every score below it as bad turns sampling noise and rounding into a strategy, and that a list where everything looks either strong or weak is usually a list read too finely." width="1200"></a>
<p>Chart: <a href="https://neerajjivnani.com/blog/category-development-index/">Neeraj Jivnani</a></p>Neeraj Jivnani, "The Category Development Index, and What a Score Above 100 Is Worth", neerajjivnani.com, https://neerajjivnani.com/blog/category-development-index/Free to republish with a link back to this page.
A Real Category, Read Across Nine Divisions
One published example makes the volume-against-index distinction clearer than an invented one can.
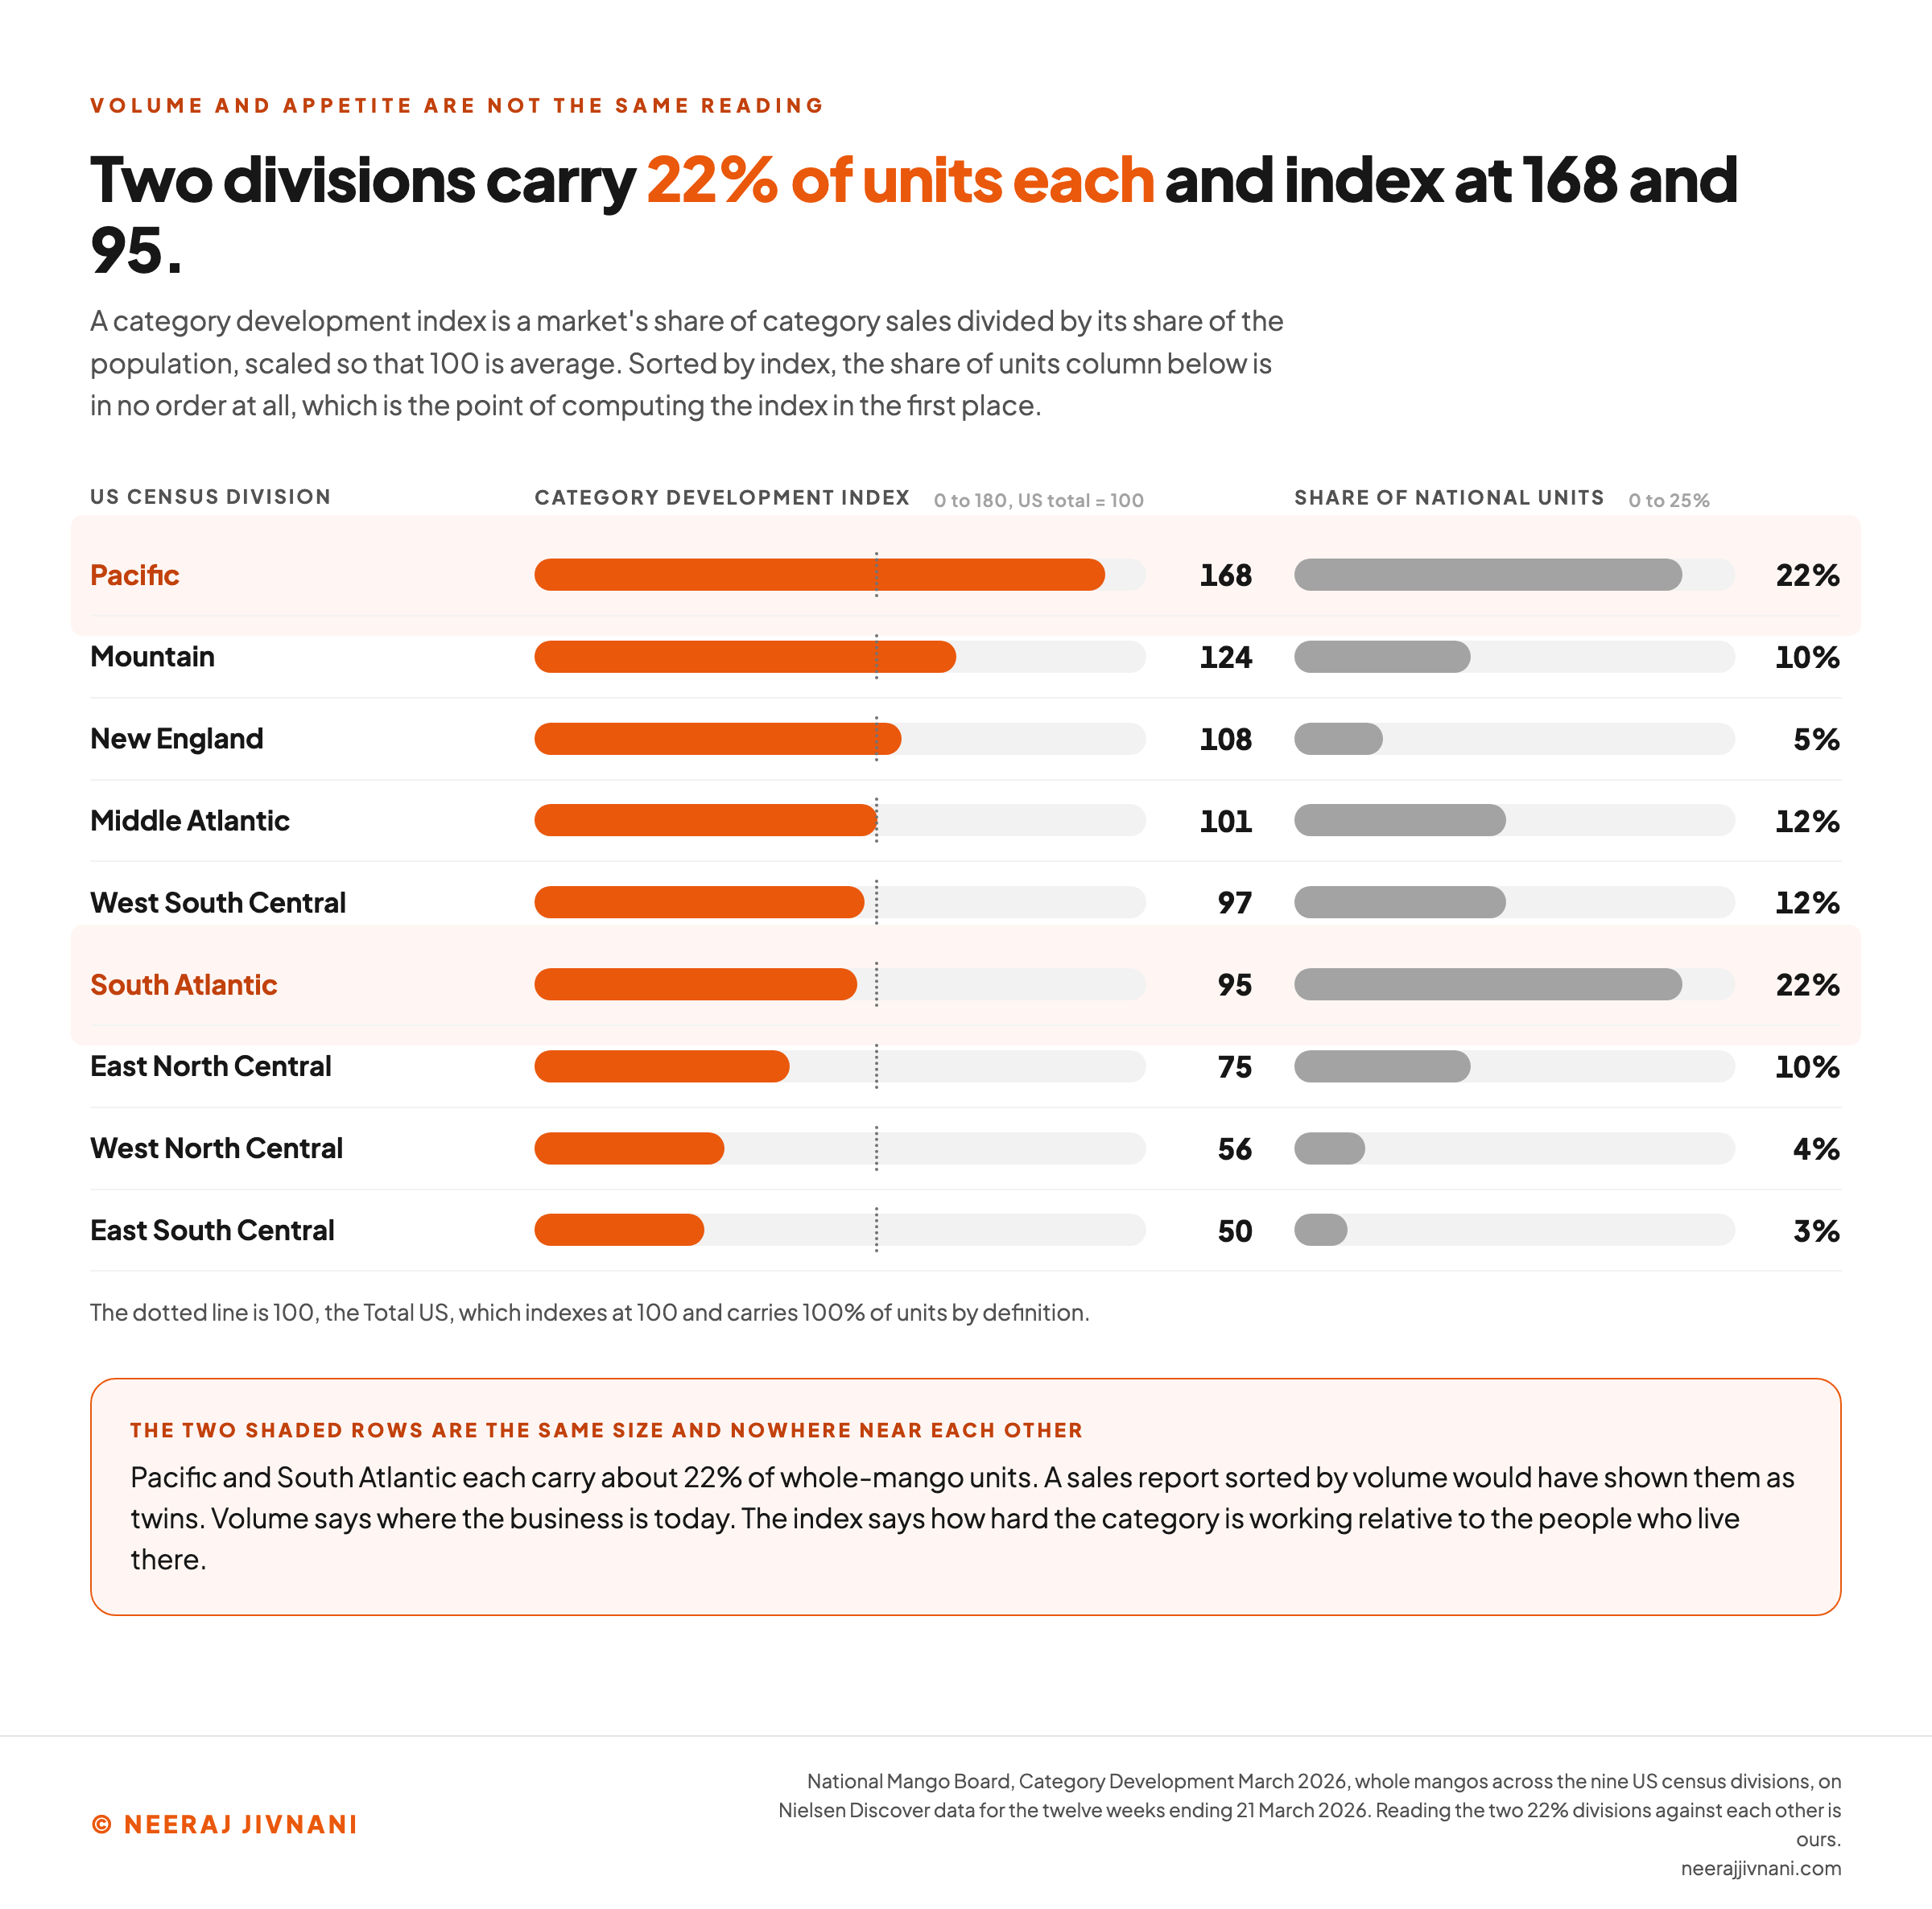
The National Mango Board's category development report for March 2026 publishes a category development index for whole mangos across the nine US census divisions, alongside each division's share of national units, on Nielsen Discover data for the twelve weeks ending 21 March 2026.
| Division | Category development index | Share of units |
|---|---|---|
| Pacific | 168 | 22% |
| Mountain | 124 | 10% |
| New England | 108 | 5% |
| Middle Atlantic | 101 | 12% |
| West South Central | 97 | 12% |
| South Atlantic | 95 | 22% |
| East North Central | 75 | 10% |
| West North Central | 56 | 4% |
| East South Central | 50 | 3% |
| Total US | 100 | 100% |
Look at the two divisions carrying 22% of units each.
The Pacific division indexes at 168 and the South Atlantic at 95. They are the same size in volume terms and nowhere near each other in appetite terms, and a sales report sorted by volume would have shown them as twins.
Volume says where the business is today. The index tells you how hard the category is working relative to the people who live there.
What the Board Did With It
The report names the Pacific, Mountain and New England divisions as over-developed, and the West North Central, East North Central and East South Central divisions as under-developed.
Its stated goal is to maintain support for the over-developed divisions while increasing support in the under-developed ones.
Notice that this is not "put the money where the index is highest". It is a split: hold what is working, and spend against the gap.
The other order
Your markets, printed twice: once in the order your sales report already gives you, and once in the order the index gives. The first row starts on the worked example earlier in this post, whose figures are round numbers picked so the arithmetic can be followed without a calculator. Nothing here is a measurement of any market.
1. Two shares for each market
Both shares over the same period, on the same market definition, in one unit throughout. A quarter of sales against an annual population figure produces a number with no interpretation at all.
2. One market has no order
The metro above
150
4.5% of category sales over 3% of the population, times 100, expressed as a whole number. Overdeveloped.
Add the market sitting next to this one in your sales report, and both orders appear.
Use this chart — embed code and citation
<a href="https://neerajjivnani.com/blog/category-development-index/"><img src="https://neerajjivnani.com/infographics/category-development-index/same-size-different-appetite.png" alt="Two-column bar chart of the nine US census divisions for whole mangos, sorted by category development index. The left column is the index against a dotted line at 100, the US total: Pacific 168, Mountain 124, New England 108, Middle Atlantic 101, West South Central 97, South Atlantic 95, East North Central 75, West North Central 56, East South Central 50. The right column is each division's share of national units, and sorted this way it runs in no order at all: 22%, 10%, 5%, 12%, 12%, 22%, 10%, 4%, 3%. The Pacific and South Atlantic rows are shaded because they carry about 22% of units each and index at 168 and 95, so a sales report sorted by volume would have shown them as twins. A band across the foot says volume says where the business is today, and the index says how hard the category is working relative to the people who live there." width="1200"></a>
<p>Chart: <a href="https://neerajjivnani.com/blog/category-development-index/">Neeraj Jivnani</a></p>Neeraj Jivnani, "The Category Development Index, and What a Score Above 100 Is Worth", neerajjivnani.com, https://neerajjivnani.com/blog/category-development-index/Free to republish with a link back to this page.
Where the Brand Development Index Comes In
The brand development index is the same arithmetic with your brand's sales in the numerator instead of the whole category's. One measures the category's strength in a market, the other measures yours.
Each is useful alone. Together they separate two problems that look identical in a sales report, and the separation happens in the two cases where the numbers disagree.
High category index, low brand index. People here buy the category and they are not buying it from you. That is a share problem in a market that has already proved the appetite exists, which is the one thing you cannot manufacture. Worth a hard look before it gets written off.
Low category index, high brand index. You are most of a small category. Taking more share will not move much, so growth has to come from growing the category itself, which is slower and costs more than winning an argument against a competitor.
Where the two agree they mostly confirm what you already suspected. Both high is a position to defend, and both low is usually a market to leave alone.
One exception is worth holding: a new category can read as both low for years before it reads as anything else.
A High Score Ranks Appetite, Not Opportunity
A high score tells you the appetite is real and tells you nothing about the cost of serving it.
"Markets with the highest index numbers do not necessarily represent the best potential." That is the third of the three points SRDS prints beside its calculators for both indexes, credited to Media Math.
The avocado tool points the other way from the same premise. Some markets are more developed than others, it notes, but high development does not signify a lack of opportunity.
Both statements are about the same gap. The index knows the category's sales and the market's population, and it knows nothing else.
It does not know what a customer costs to reach there, who else is already selling there, whether you can get distribution, or what media weight costs per thousand people.
Two markets at 150 can be one you already saturate and one you have never shipped to.
Acting on a Low Index
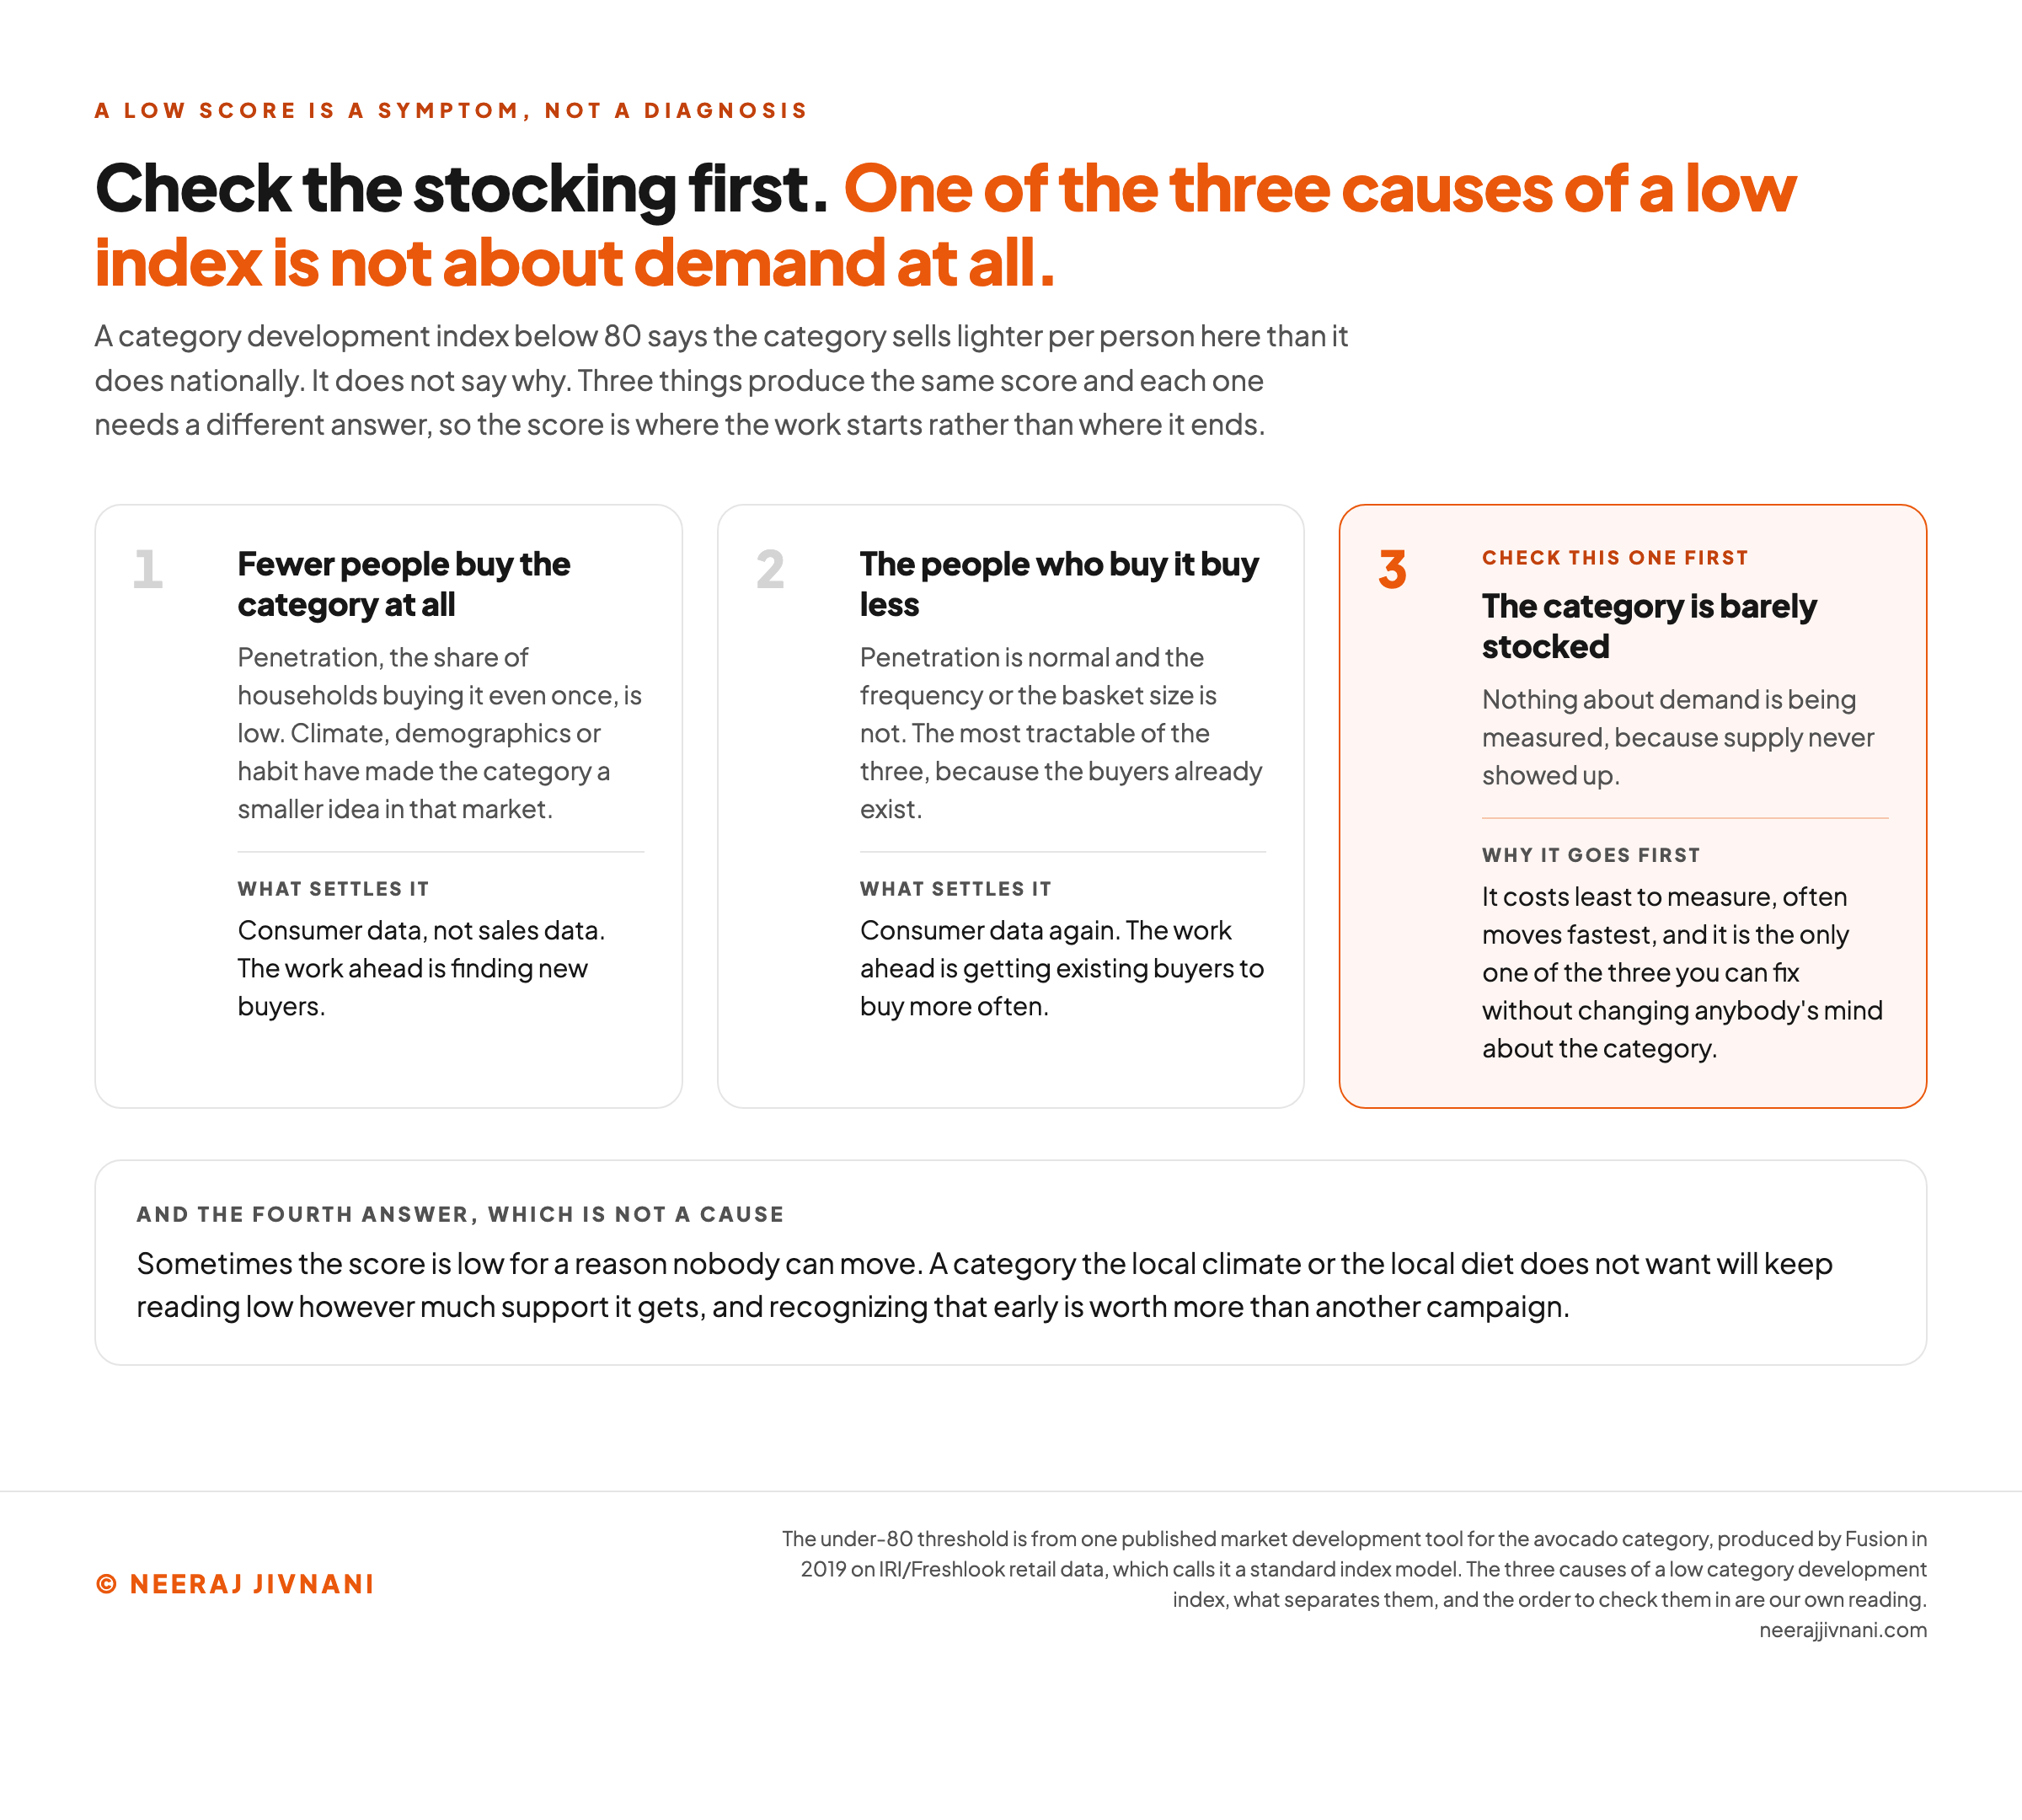
A low index is a symptom with three plausible causes, and what you do about it depends on which one it is.
- Fewer people buy the category at all. Penetration, the share of households buying it even once, is low. Climate, demographics or habit have made the category a smaller idea in that market.
- The people who buy it buy less. Penetration is normal and the frequency or the basket size is not. This is the most tractable of the three, because the buyers already exist.
- The category is barely stocked. Nothing about demand is being measured, because supply never showed up.
Check the third one first. Distribution costs least to measure, often moves fastest, and is the only one of the three you can fix without changing anybody's mind about the category.
Penetration and frequency need consumer data rather than sales data, which is a market research job, and separating them decides whether the work ahead is finding new buyers or getting existing ones to buy more often. Those are different budgets and different messages.
Sometimes the honest answer is that the score is low for a reason nobody can move.
A category the local climate or the local diet does not want will keep reading low however much support it gets. Recognizing that early is worth more than another campaign.
Use this chart — embed code and citation
<a href="https://neerajjivnani.com/blog/category-development-index/"><img src="https://neerajjivnani.com/infographics/category-development-index/three-causes-one-order.png" alt="Three cards setting out what a low category development index can mean and how to tell the causes apart. The first is that fewer people buy the category at all, so penetration, the share of households buying it even once, is low, and climate, demographics or habit have made the category a smaller idea in that market; consumer data rather than sales data settles it, and the work ahead is finding new buyers. The second is that the people who buy it buy less, so penetration is normal and the frequency or the basket size is not, which is the most tractable of the three because the buyers already exist; consumer data settles it again, and the work ahead is getting existing buyers to buy more often. The third card is highlighted and flagged to check first: the category is barely stocked, so nothing about demand is being measured because supply never showed up, and it goes first because it costs least to measure, often moves fastest, and is the only one of the three you can fix without changing anybody's mind about the category. A band across the foot says sometimes the score is low for a reason nobody can move, because a category the local climate or the local diet does not want will keep reading low however much support it gets." width="1200"></a>
<p>Chart: <a href="https://neerajjivnani.com/blog/category-development-index/">Neeraj Jivnani</a></p>Neeraj Jivnani, "The Category Development Index, and What a Score Above 100 Is Worth", neerajjivnani.com, https://neerajjivnani.com/blog/category-development-index/Free to republish with a link back to this page.
The Same Three Letters in a Retailer's Report
Inside retail category management the same abbreviation names a different calculation, and meeting it unprepared is how two people end up arguing about a number they define differently.
There the index compares a brand's or segment's share at a retailer with that brand's or segment's share in the wider market, scaled to 100, which is how Sue Nicholls of the category management training company CMKG sets it out.
The inputs are two shares of sales. Population does not enter it.
The decision it feeds is also different. It asks whether a retailer's assortment over-indexes or under-indexes against the market, which is a conversation between a supplier and a buyer rather than a media plan.
Nicholls's warning travels across both versions. An index, she writes, can be mathematically correct and strategically misleading at the same time, because a retailer may be deliberately stronger in some brands, segments or price tiers than the broader market is.
If you are handed an index and the decision hangs on it, ask what went in the numerator and what went in the denominator before you argue about the number.
Using the Index Well
The category development index is a small, honest instrument that answers one question well and gets asked to answer several it cannot.
It tells you where a category sells harder than the population alone would predict. Computed on matched inputs and read against a wide middle band, that is a real finding, and it is invisible in any report sorted by volume.
Treat the result as a shortlist and nothing stronger.
The market that indexes highest has proved the appetite and proved nothing else. The market that indexes lowest has raised a question nobody has answered yet.
Everything that decides where the money should go sits outside the arithmetic and has to be brought to it: the cost of reaching people there, the competition already there, and whether you can get the product on a shelf.