What a Search Volume Number Counts, and What It Leaves Out
That figure is an estimate, not a tally. See what your tool is really measuring, what it leaves out, and how much weight to put on it.


/ On this page9 sections
A search volume is an estimate of how many times a phrase gets typed into a search engine in an average month. It is a model's output, not a tally of people.
Four things are already inside that figure before you read it, and none of them shows on its face.
How much weight it can carry follows from those four.
A Search Volume Is an Estimate, and Four Things Are Already Inside It
The averaging, the rounding, the grouping and the scoping are all documented by the people who produce the number, which is the part worth knowing.
The figure is approximate by construction, and knowing how it got that way tells you how hard to lean on it.
Google Ads Help defines the metric your tool is descended from as "the average number of times people have searched for a keyword and its close variants based on the month range as well as the location and Search Network settings you selected."
That one sentence carries three of the four.
The fourth is in the same document.
| what happens to the figure | Google Ads Help's own wording | what we take from it |
|---|---|---|
| It is flattened across a year | "averaged over a 12-month period", and counted "regardless of language" | A December term reads as a moderate figure in June, and two languages arrive under one total |
| It is rounded before you see it | "Your search volume statistics are rounded", which is why volumes "might not add up as you'd expect" across locations | If Google's own numbers stop adding up across locations, a small gap between two phrases is not a gap |
| It merges your phrase with its variants | "determined only for exact keyword matches", and it covers "a keyword and its close variants" | Both are true of the same number, so even the strictest reading of your phrase still merges wordings |
| It is scoped, not universal | the "location and Search Network settings you selected" | The same phrase is a different number in another country, and the setting is easy to leave wrong |
The Twelve-Month Average Hides the Shape of a Year
Of the four, the averaging costs people the most, and it costs them quietly. Nothing on the face of the number says how those months differed.
Say a phrase is searched hard for six weeks a year and ignored for the other forty-six. It arrives on your screen looking perfectly steady.
The trend line most tools print beside the figure is what shows you the shape of the year.
Read the two together, or you are reading half of it.
Where Your Number Comes From
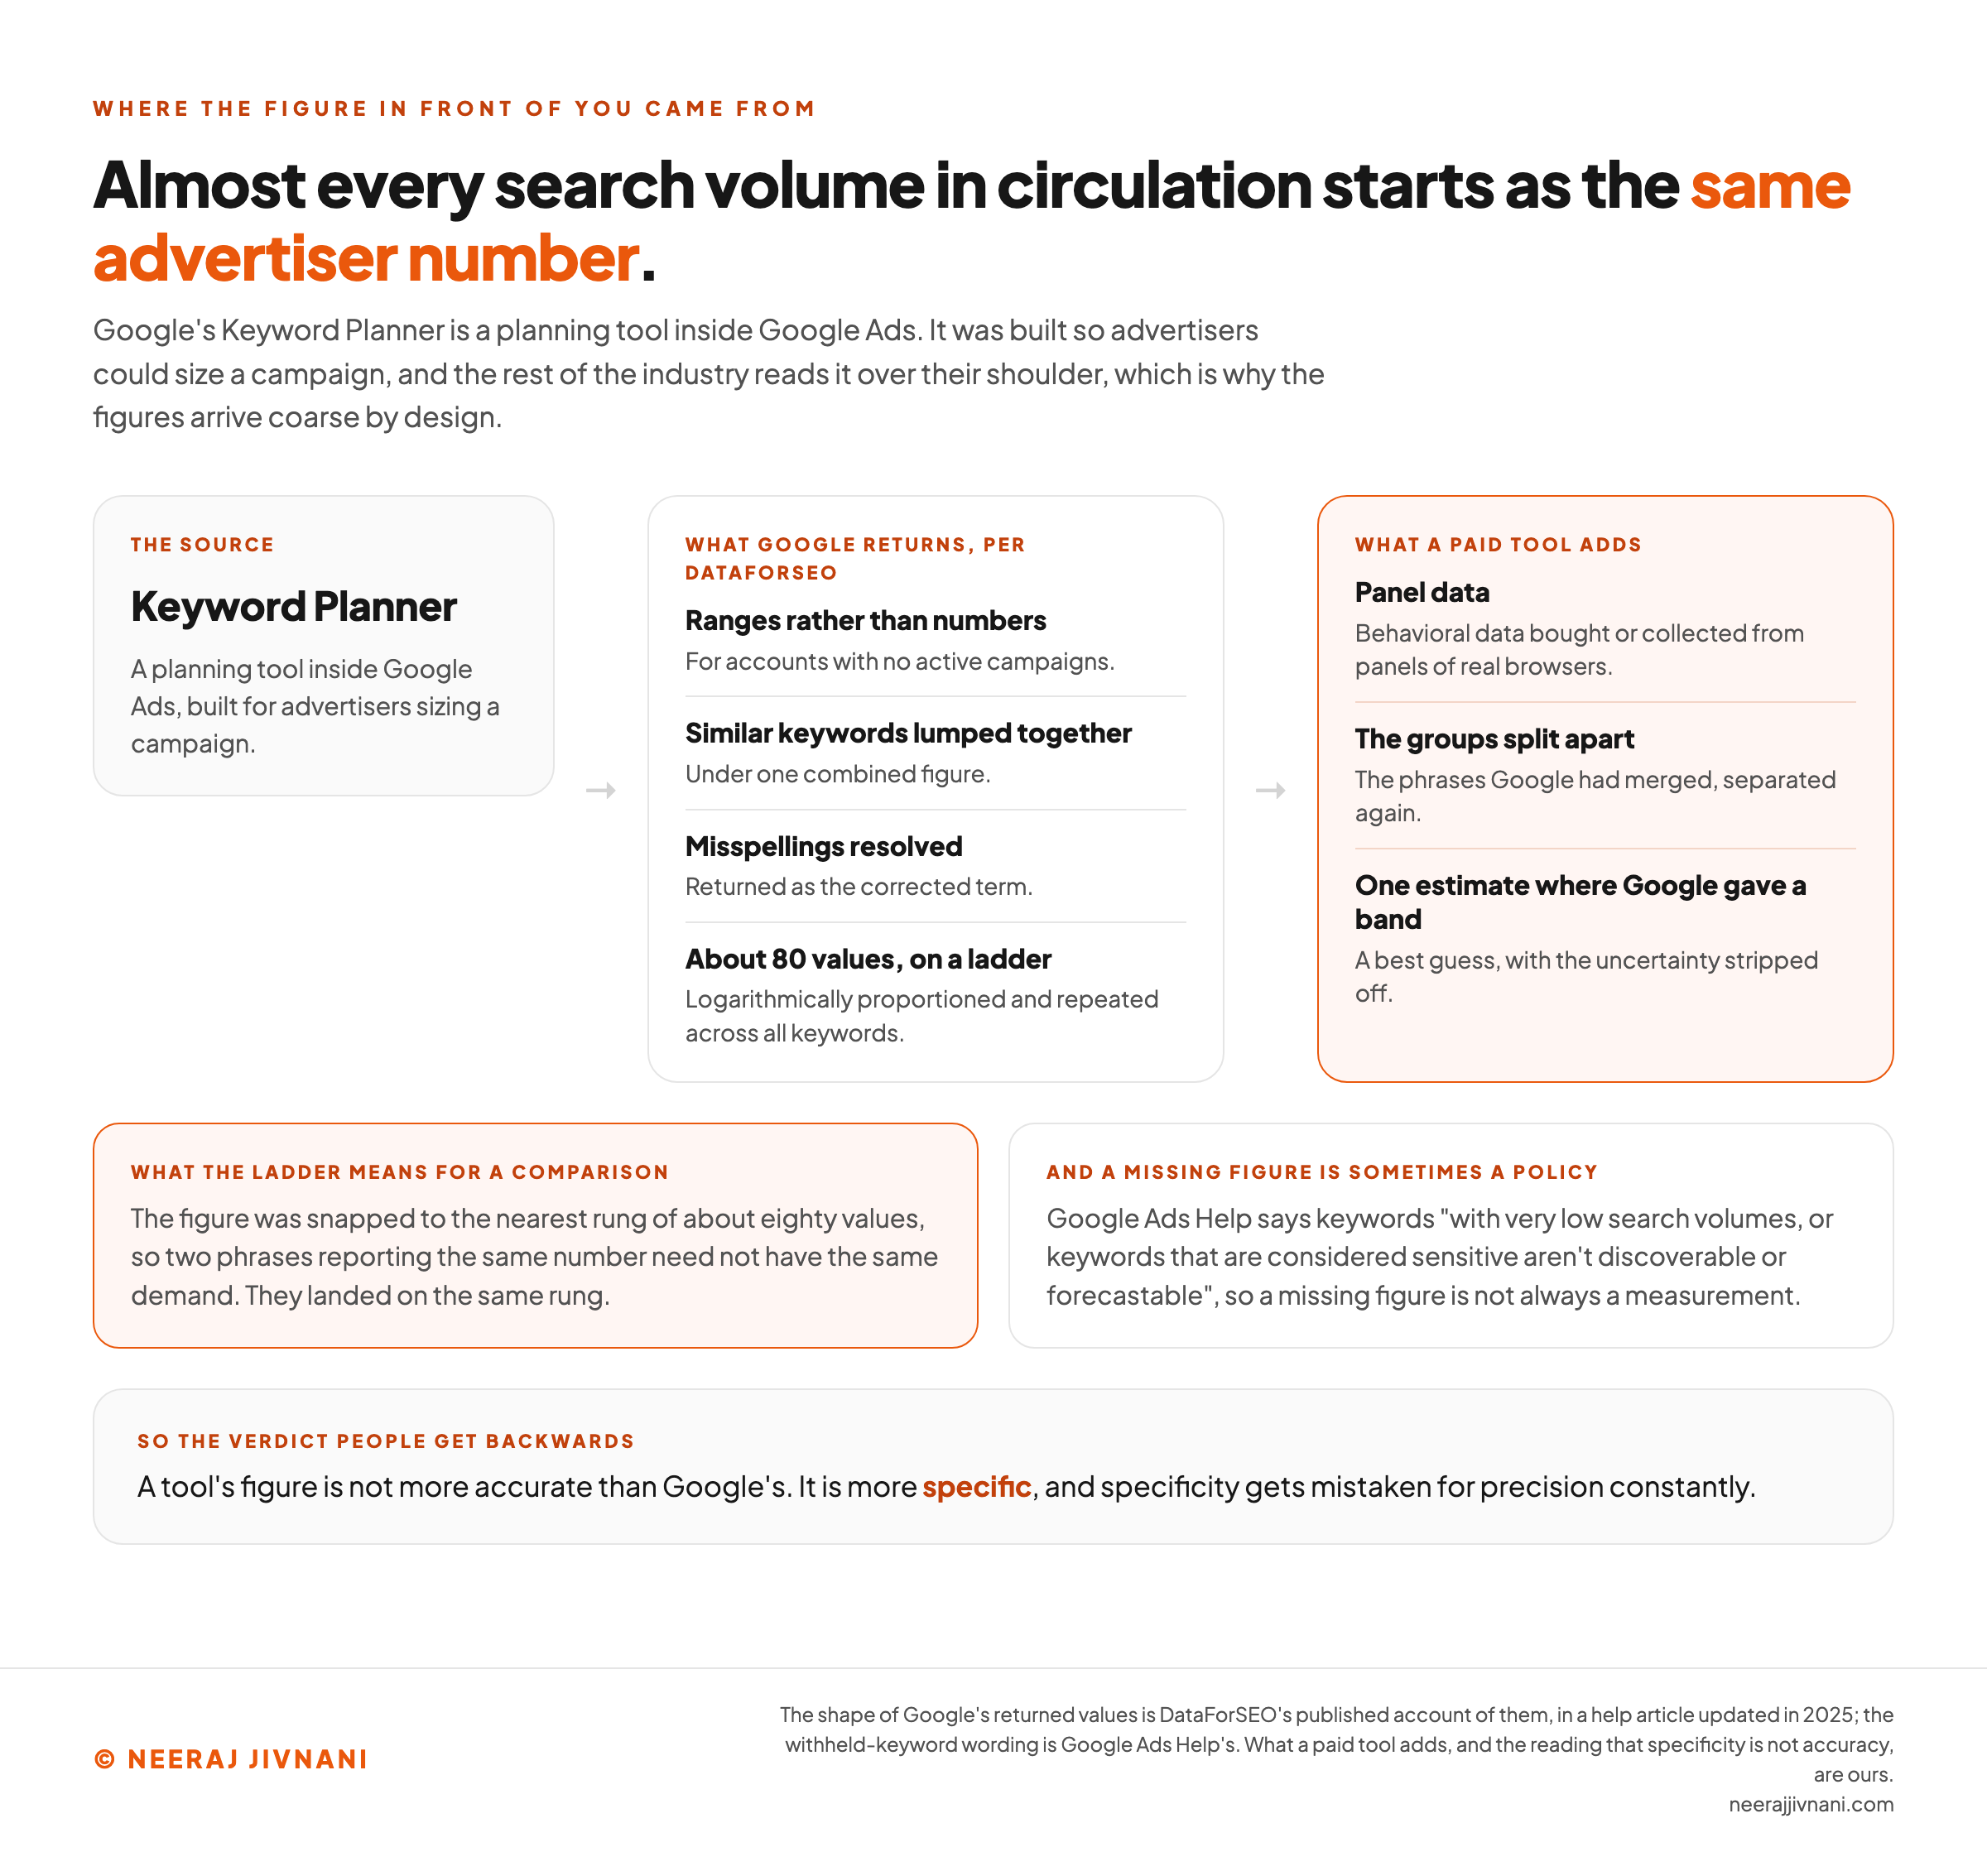
Almost every search volume in circulation traces back to one place: Google's Keyword Planner, which is a planning tool inside Google Ads. It was built so advertisers could size a campaign, and the rest of the industry reads it over their shoulder for keyword research.
That origin explains the shape of what you get.
The figures arrive coarse by design.
DataForSEO sells keyword data through an application programming interface (API). Its help article, updated in 2025, describes what Google returns.
- Ranges rather than numbers for accounts with no active campaigns, so the figure arrives as a band.
- Similar keywords lumped together under one combined figure, so part of the total belongs to phrases you did not ask about.
- Misspellings resolved to the corrected term, so a typo you deliberately checked comes back as the spelling you did not.
And this: "around 80 search volume values that are logarithmically proportioned and repeated across all keywords."
Read that last one twice. It means the figure in front of you was snapped to the nearest rung on a ladder of roughly eighty values, so two phrases reporting the same number need not have the same demand.
They landed on the same rung.
Some phrases return no figure at all. Google Ads Help says keywords "with very low search volumes, or keywords that are considered sensitive aren't discoverable or forecastable", so a missing figure is sometimes a policy rather than a measurement.
What a Third-Party Tool Adds
A paid tool starts from that same coarse data and tries to improve it.
It buys or collects behavioral data from panels of real browsers, then uses it to split apart the phrases Google grouped and to put a single estimate where Google gave a band.
This is genuinely useful, and it is still a model.
The panel is a sample, the sample is smaller for rare phrases, and the number it produces is a best guess with the uncertainty stripped off.
So a tool's figure is not more accurate than Google's.
It is more specific, and specificity gets mistaken for precision constantly.
Use this chart — embed code and citation
<a href="https://neerajjivnani.com/blog/search-volume/"><img src="https://neerajjivnani.com/infographics/search-volume/the-number-you-read-is-a-model.png" alt="A three stage diagram of where a search volume comes from. At the left is the source, Keyword Planner, a planning tool inside Google Ads built so advertisers could size a campaign. An arrow leads to what Google returns, credited to DataForSEO: ranges rather than numbers for accounts with no active campaigns, similar keywords lumped together under one combined figure, misspellings resolved and returned as the corrected term, and about eighty values on a ladder, logarithmically proportioned and repeated across all keywords. A second arrow leads to a highlighted panel of what a paid tool adds: behavioral data bought or collected from panels of real browsers, the phrases Google had merged separated again, and one estimate where Google gave a band, which is a best guess with the uncertainty stripped off. Two notes below read that the figure was snapped to the nearest rung of about eighty values, so two phrases reporting the same number need not have the same demand because they landed on the same rung, and that Google Ads Help says keywords with very low search volumes, or keywords that are considered sensitive, are not discoverable or forecastable, so a missing figure is not always a measurement. A band across the foot reads that a tool's figure is not more accurate than Google's, that it is more specific, and that specificity gets mistaken for precision constantly." width="1200"></a>
<p>Chart: <a href="https://neerajjivnani.com/blog/search-volume/">Neeraj Jivnani</a></p>Neeraj Jivnani, "What a Search Volume Number Counts, and What It Leaves Out", neerajjivnani.com, https://neerajjivnani.com/blog/search-volume/Free to republish with a link back to this page.
The Two Free Numbers Do Not Count the Same Searches
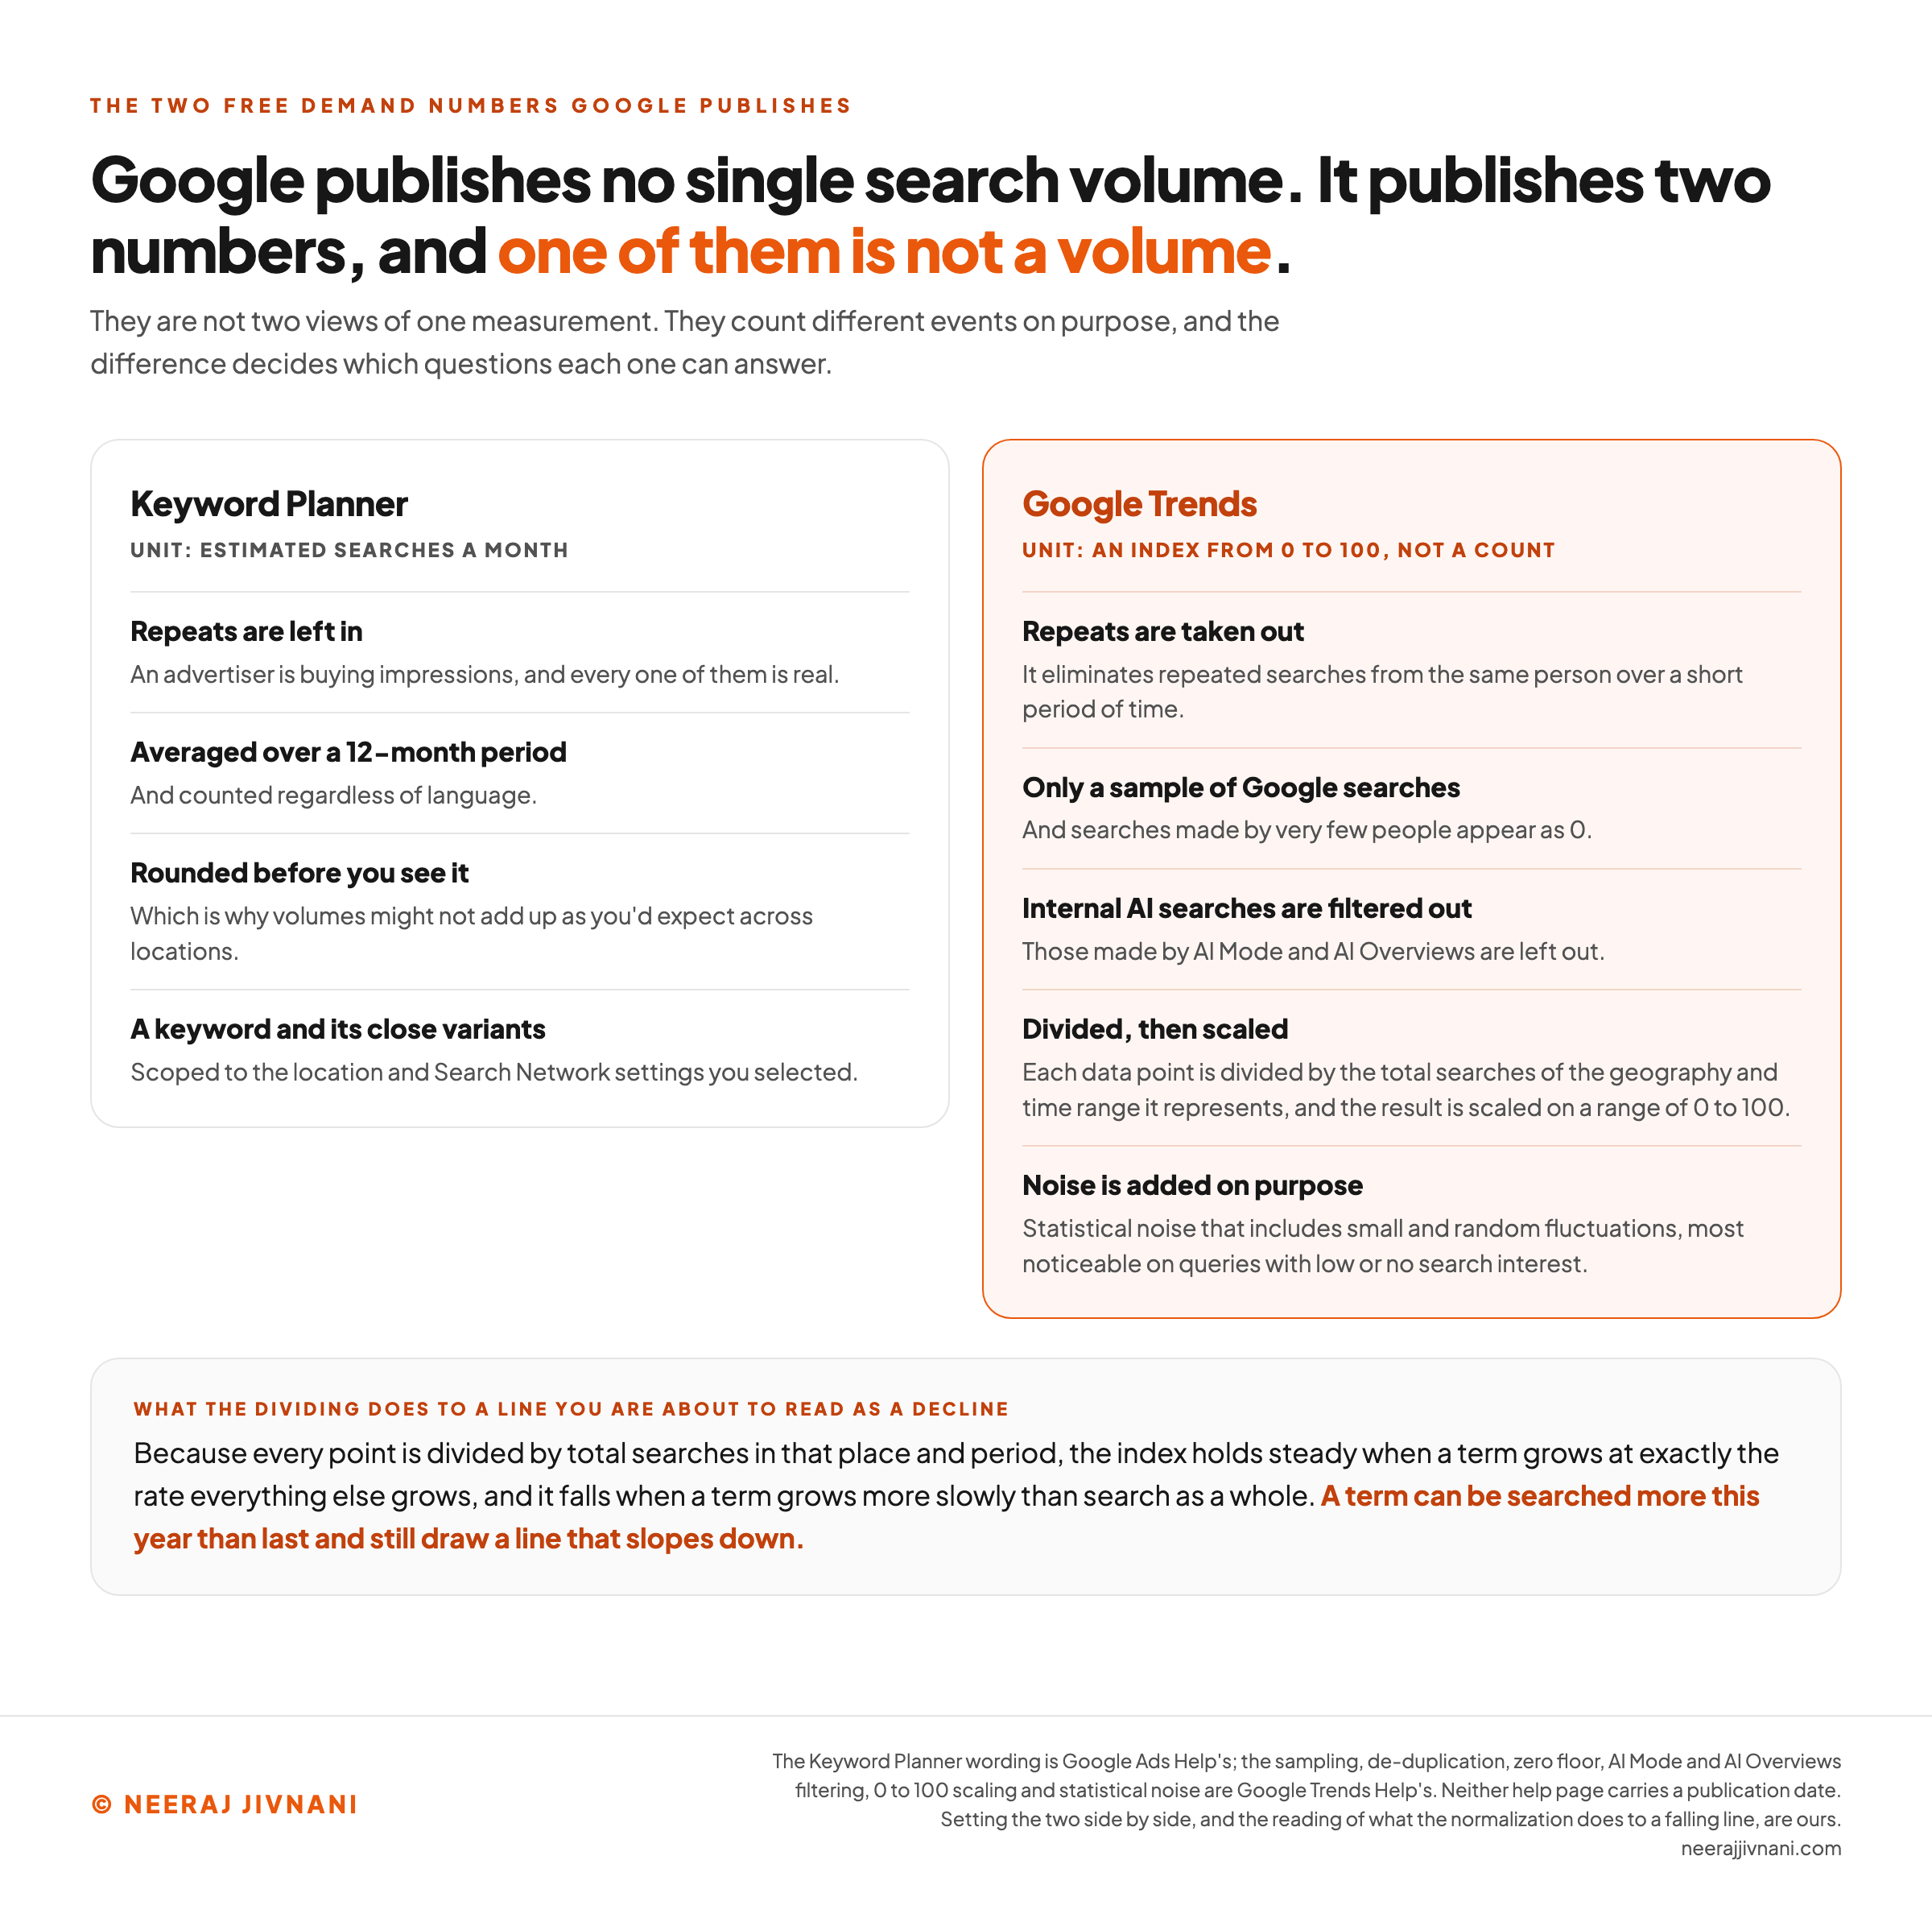
Google gives away two readings of demand for a phrase, and they are not two views of one measurement. They count different events on purpose.
Start with the repeats. Keyword Planner leaves them in, because an advertiser is buying impressions and every one of them is real.
Google Trends strips them out, and documents doing it. The product "eliminates repeated searches from the same person over a short period of time."
Among the things it also leaves out are searches "made by very few people", which "appear as 0", and, in Google's own words, "internal searches made by AI Mode and AI Overviews."
Then it changes units entirely. Trends uses "only a sample of Google searches", divides "each data point" by "the total searches of the geography and time range it represents", and scales the result "on a range of 0 to 100."
So the line on a Trends chart is not a volume.
It is a share of everything, drawn against its own highest point.
One more property is worth knowing before you read a spike. Google deliberately adds "statistical noise that includes small and random fluctuations that don't represent actual search behavior", and says it is "most noticeable on queries with low or no search interest."
On a rare term, a one-off spike may be the privacy protection rather than a person.
Why a Falling Line Does Not Mean Falling Demand
A falling Trends line is not evidence of falling demand, and the reason sits in the normalization. This reading is ours; Google publishes the method and does not draw the consequence.
Because every point is divided by total searches in that place and period, the index holds steady when a term grows at exactly the rate everything else grows. It falls when a term grows more slowly than search as a whole.
A term can be searched more this year than last and still draw a line that slopes down.
That is not a flaw. It is what the number was built to show, which is relative interest, and it is the wrong instrument for the question "is this getting bigger in absolute terms." None of the free routes below answers that one cleanly.
Use this chart — embed code and citation
<a href="https://neerajjivnani.com/blog/search-volume/"><img src="https://neerajjivnani.com/infographics/search-volume/google-publishes-two-and-one-is-not-a-volume.png" alt="A side by side comparison of the two free demand numbers Google publishes. The left column, Keyword Planner, is labeled with the unit estimated searches a month, and lists that repeats are left in because an advertiser is buying impressions and every one of them is real, that the figure is averaged over a twelve month period and counted regardless of language, that it is rounded before you see it, which is why volumes might not add up as you would expect across locations, and that it covers a keyword and its close variants, scoped to the location and Search Network settings you selected. The right column, highlighted in orange and headed Google Trends, is labeled with the unit an index from zero to one hundred, not a count, and lists that repeated searches from the same person over a short period of time are eliminated, that it uses only a sample of Google searches and that searches made by very few people appear as zero, that internal searches made by AI Mode and AI Overviews are left out, that each data point is divided by the total searches of the geography and time range it represents and the result scaled on a range of zero to one hundred, and that statistical noise including small and random fluctuations is added on purpose, most noticeable on queries with low or no search interest. A band across the foot reads that because every point is divided by total searches in that place and period, the index holds steady when a term grows at exactly the rate everything else grows and falls when a term grows more slowly than search as a whole, so a term can be searched more this year than last and still draw a line that slopes down." width="1200"></a>
<p>Chart: <a href="https://neerajjivnani.com/blog/search-volume/">Neeraj Jivnani</a></p>Neeraj Jivnani, "What a Search Volume Number Counts, and What It Leaves Out", neerajjivnani.com, https://neerajjivnani.com/blog/search-volume/Free to republish with a link back to this page.
Where to Get a Number Without Paying for One
You have four free routes, and they are good for different questions. Pick by the question rather than by convenience.
- Keyword Planner, inside a Google Ads account. The closest thing to the source, and Google's own averaged figure for a list of phrases at once.
- Google Trends, for the shape of demand over time. It will never hand you a count, and it is the right instrument when the question is direction.
- Search Console, for a site you own. Impressions there are a real count rather than an estimate, and they describe your own market instead of the whole one.
- The free bulk checkers, which paste Google's figures back to you in quantity. Fast for validating a long list, with no context around the numbers.
None of these is the number.
They are four instruments, and the answer you get depends on which one you picked up.
One habit is worth more than the rest. Read the figure and the trend line together, in the same country setting, every time.
A figure read without the shape of the year behind it is where good phrases get misjudged.
What Counts as a Good Number
There is no threshold, and any number offered as one is somebody's rule of thumb rather than a fact about search.
A good figure is one where the arithmetic works. Take the volume, take the share of it you could plausibly win, and multiply by what a single visit is worth to you.
That is one month. If a year or two of it clears what the page costs to make and keep, the number is good.
Run it honestly and it surprises people in both directions.
Say a specialist consultancy finds fifty searches a month for a phrase nobody has written a decent page for, and one inquiry a quarter pays for a month of work. That fifty is excellent.
Now say a general blog finds a term many times bigger, where the searcher is a student and the top three results belong to sites a decade older. All that demand is worth nothing to it.
Scale helps as orientation rather than as a rule. Under a few hundred a month, one good month distorts the average; in the tens of thousands, you are competing with everyone who also noticed.
What your own numbers rule out
There is no threshold, and any number offered as one is somebody’s rule of thumb rather than a fact about search. The line that does exist is yours, and it is built from three things only you have.
The first two boxes are money and the third is a percentage. Keep the two money boxes in the same unit, whichever one you work in, because the arithmetic does not care which. Those three round numbers are placeholders and not measurements. Type yours over them. Put the cost on the same monthly footing as the volume: if the page is mostly a one-off build, spread it across the months you expect it to keep earning.
Your line, on your own numbers
500searches a month
Below that, on what you typed, a phrase cannot pay for the page. At the line itself, winning 10 percent of it and earning 10 a visit returns 500, which is exactly what the page costs.
Run it honestly and it surprises people in both directions. A small figure on a phrase nobody has served properly can clear a high line, and a very large one can fail a low one.
Nothing to test yet. The line above is the useful half on its own: it is the one thing a volume can be checked against without anybody publishing a rule of thumb.
Scale, as orientation rather than as a rule
Under a few hundred a month, one good month distorts the average. In the tens of thousands, you are competing with everyone who also noticed. Neither of those is a threshold, and neither of them moves the line above.
The Number Is Demand, and Your Share of It Is Smaller
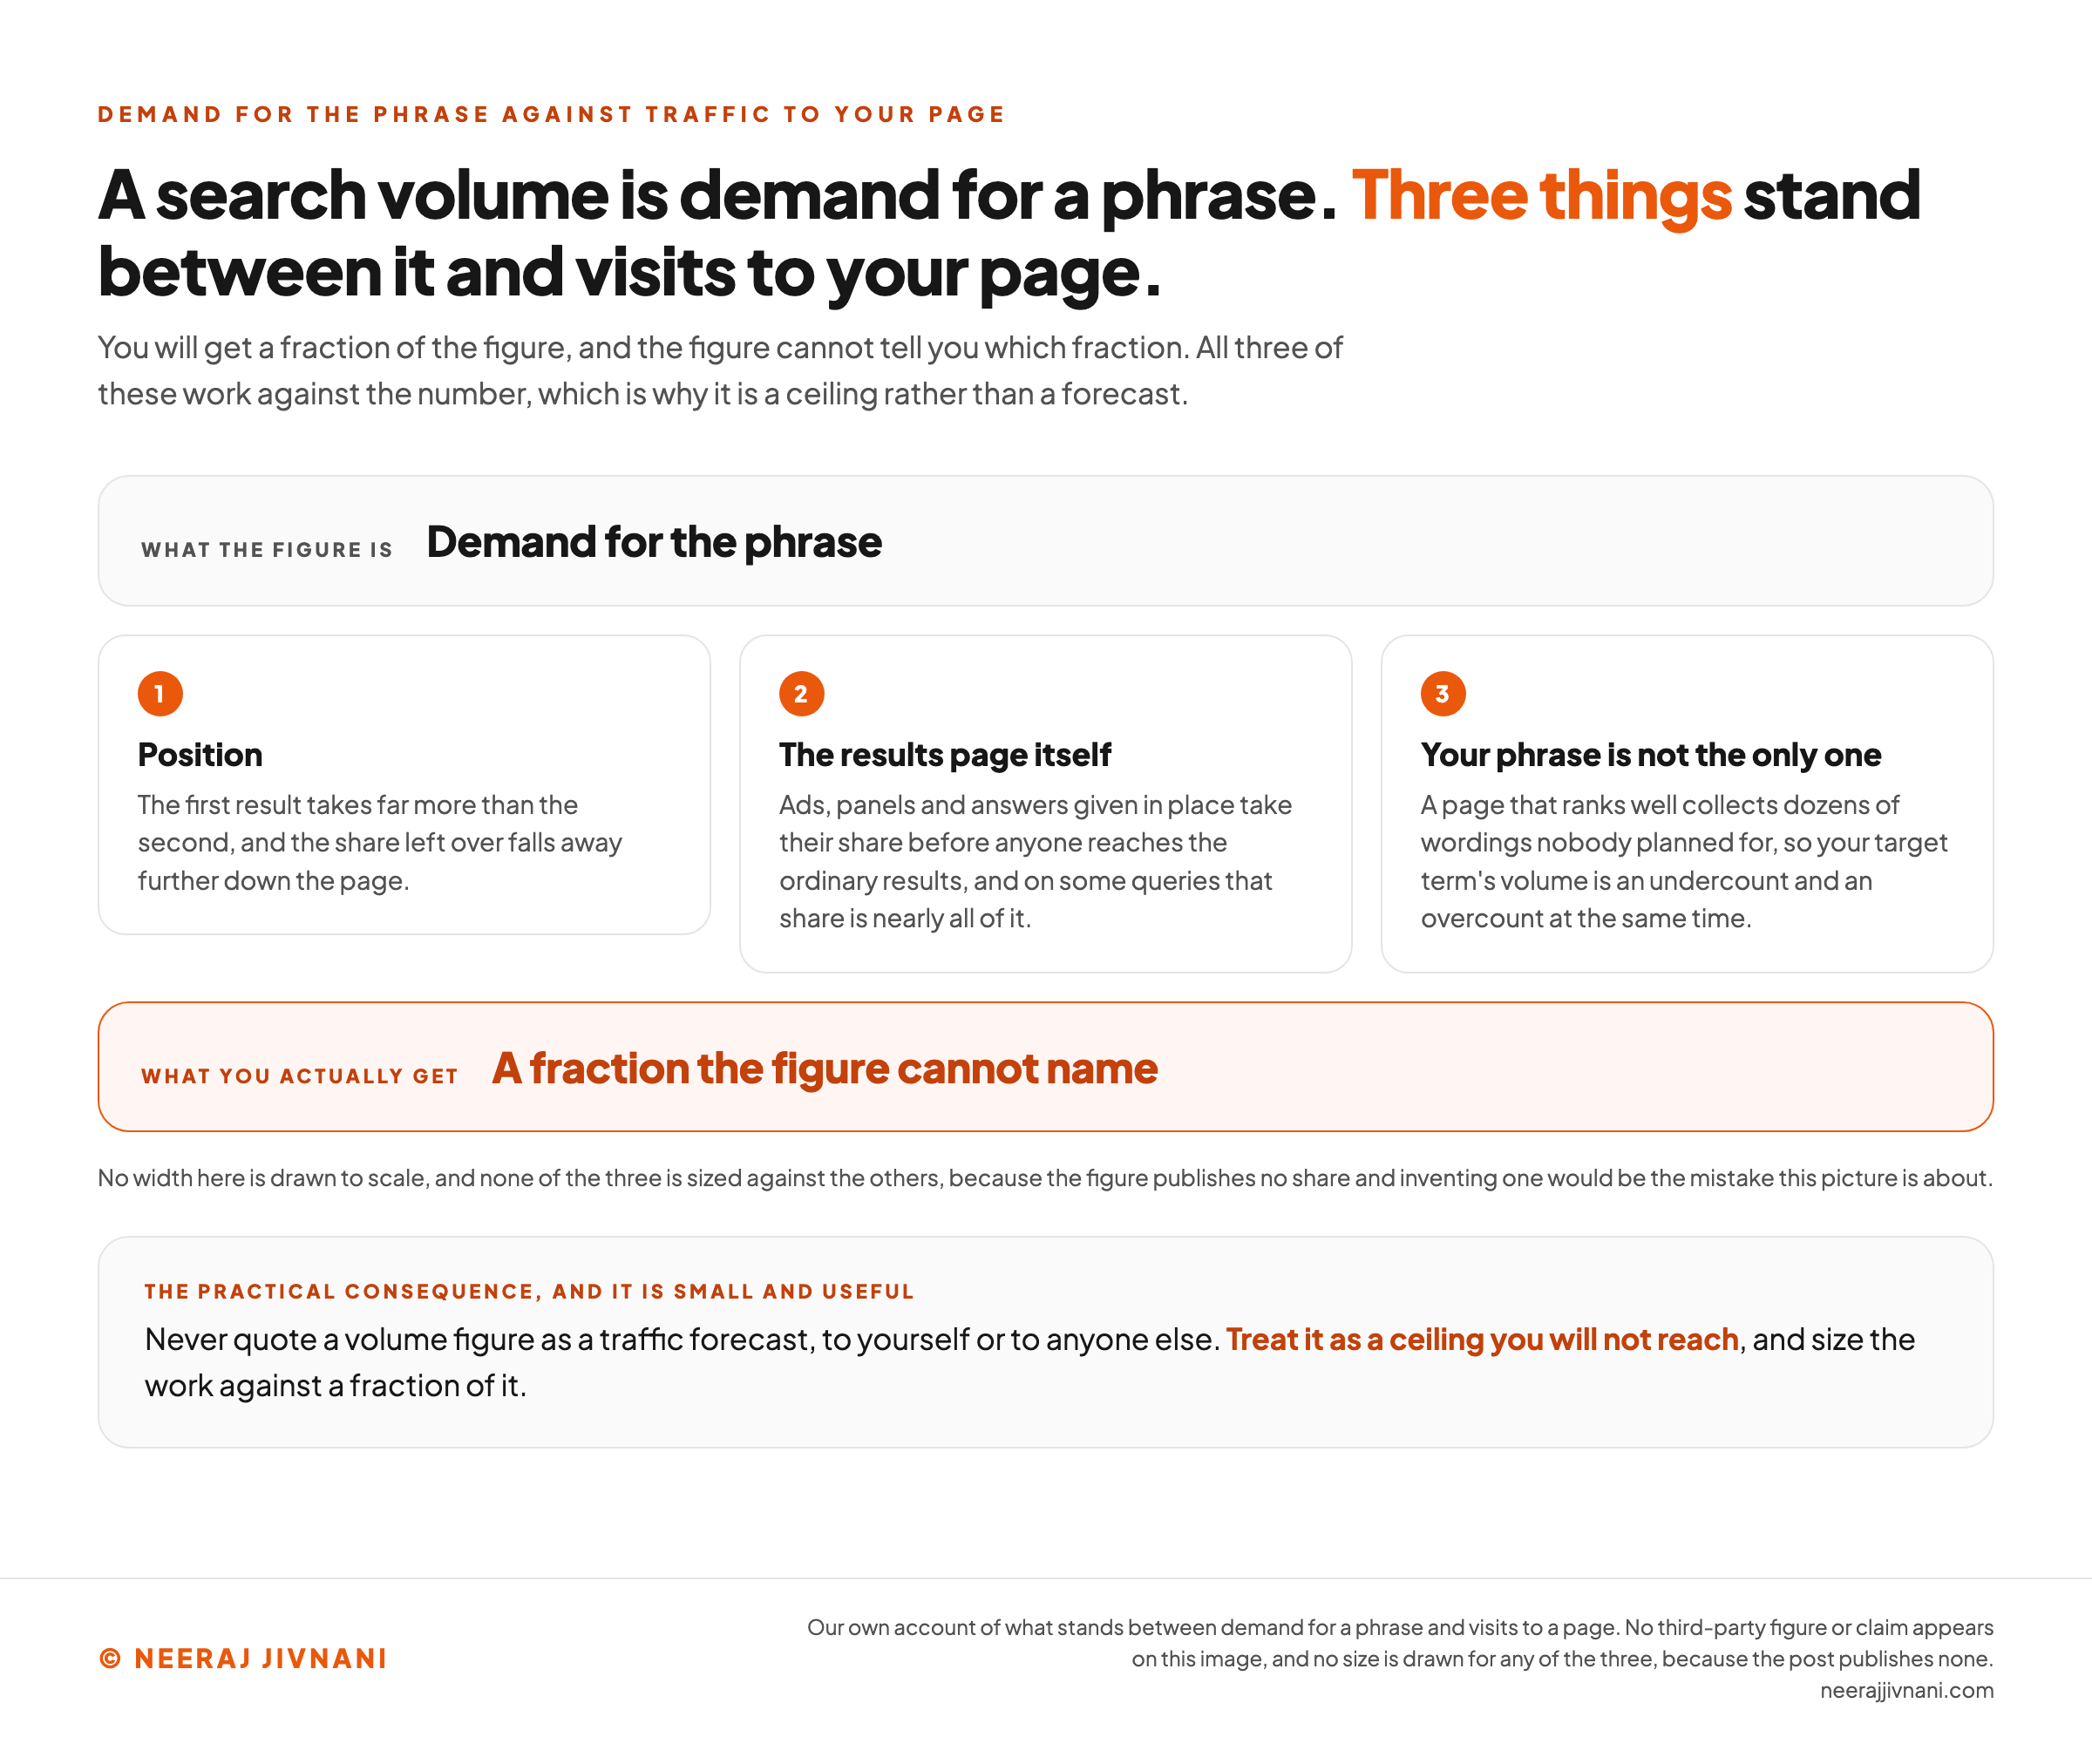
A search volume is demand for a phrase, not visits to your page. You will get a fraction of it, and the figure cannot tell you which fraction.
Three things sit in the gap, and all three work against the number.
- Position. The first result takes far more than the second, and the share left over falls away further down the page.
- The results page itself. Ads, panels and answers given in place take their share before anyone reaches the ordinary results, and a search that ends there without a click is a zero-click search. On some queries that share is nearly all of it.
- The phrase you targeted is not the only one. A page that ranks well collects dozens of wordings nobody planned for, so your target term's volume is an undercount and an overcount at the same time.
The practical consequence is small and useful.
Never quote a volume figure as a traffic forecast, to yourself or to anyone else.
Treat it as a ceiling you will not reach, and size the work against a fraction of it.
Use this chart — embed code and citation
<a href="https://neerajjivnani.com/blog/search-volume/"><img src="https://neerajjivnani.com/infographics/search-volume/three-things-stand-between-it-and-you.png" alt="A diagram of what stands between demand for a phrase and visits to a page. A panel at the top is labeled demand for the phrase, which is what the figure is. Three numbered cards sit below it. The first, position, reads that the first result takes far more than the second and that the share left over falls away further down the page. The second, the results page itself, reads that ads, panels and answers given in place take their share before anyone reaches the ordinary results, and on some queries that share is nearly all of it. The third, your phrase is not the only one, reads that a page which ranks well collects dozens of wordings nobody planned for, so your target term's volume is an undercount and an overcount at the same time. A highlighted panel at the foot of the run is labeled what you actually get, a fraction the figure cannot name. A line beneath states that no width is drawn to scale and none of the three is sized against the others, because the figure publishes no share. A closing band reads that you should never quote a volume figure as a traffic forecast, to yourself or to anyone else, and should treat it as a ceiling you will not reach and size the work against a fraction of it." width="1200"></a>
<p>Chart: <a href="https://neerajjivnani.com/blog/search-volume/">Neeraj Jivnani</a></p>Neeraj Jivnani, "What a Search Volume Number Counts, and What It Leaves Out", neerajjivnani.com, https://neerajjivnani.com/blog/search-volume/Free to republish with a link back to this page.
What the Number Cannot Settle
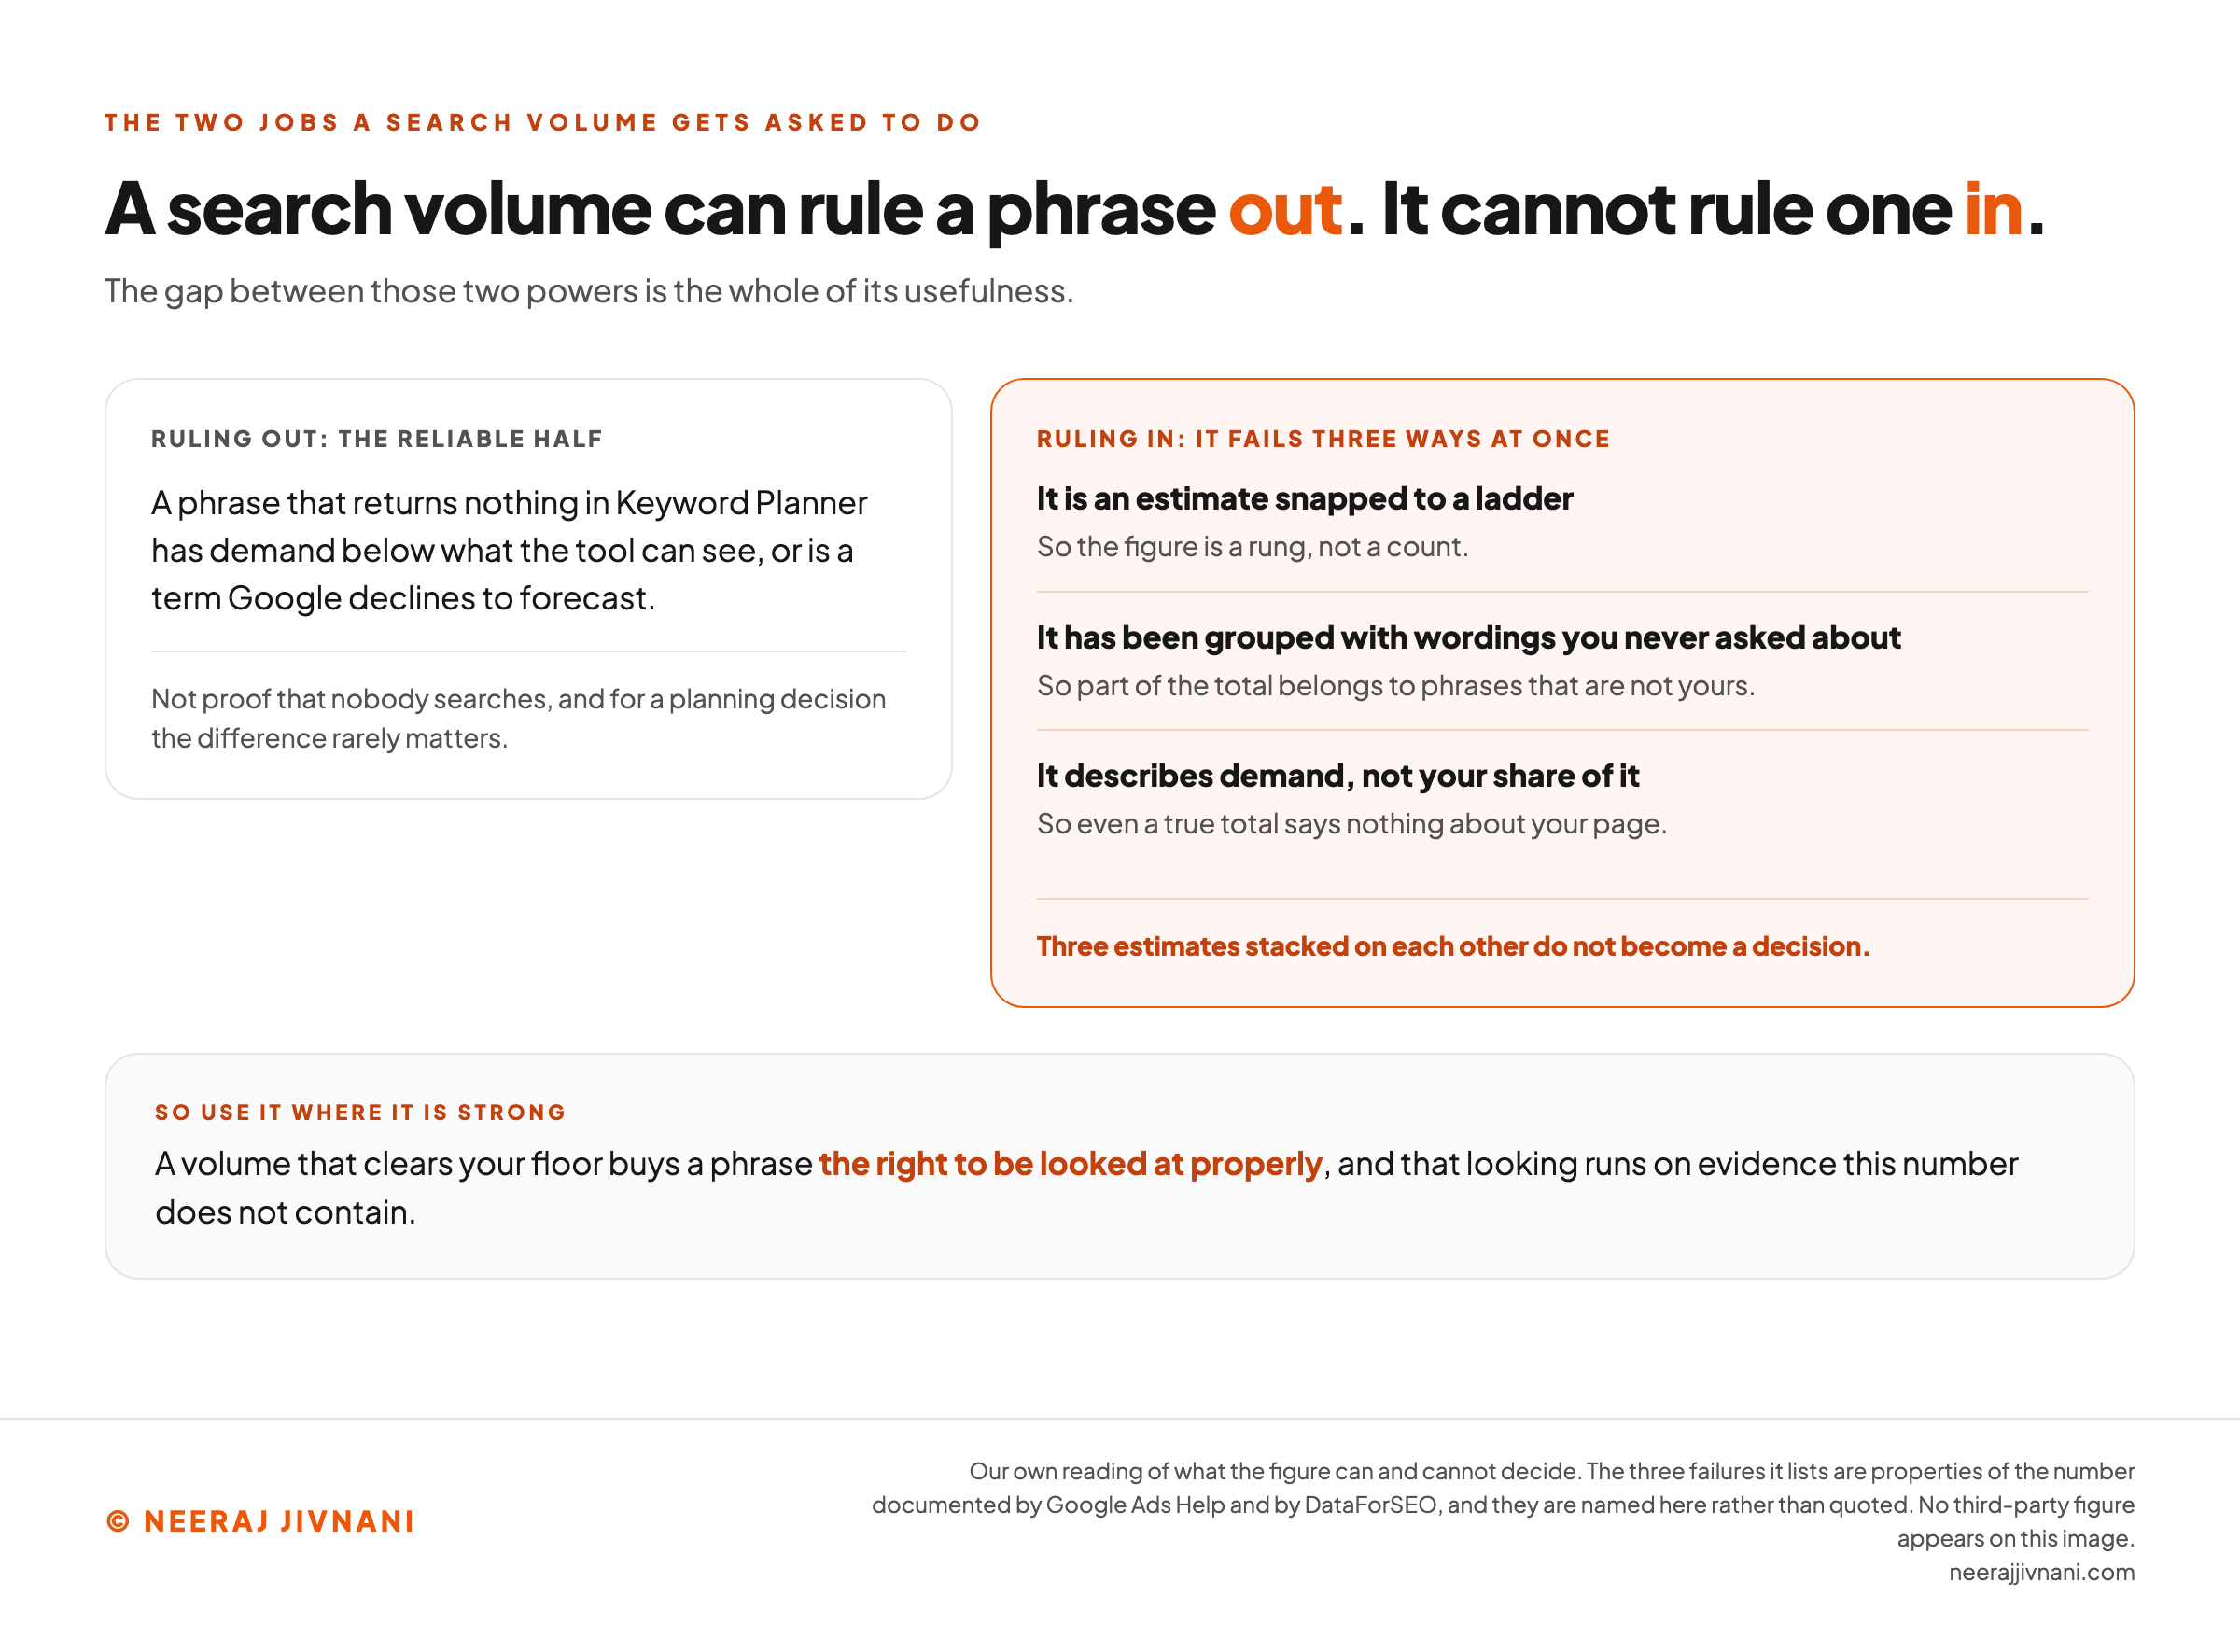
The number can rule a phrase out. It cannot rule one in, and the gap between those two powers is the whole of its usefulness.
Ruling out is the reliable half, with one qualification.
A phrase that returns nothing in Keyword Planner has demand below what the tool can see, or is a term Google declines to forecast. It is not proof that nobody searches, and for a planning decision the difference rarely matters.
Ruling in is where it fails, and it fails three ways at once.
The figure is an estimate snapped to a ladder, it has been grouped with wordings you never asked about, and it describes demand rather than your share of it.
Three estimates stacked on each other do not become a decision.
So use it at the floor, where it is strong. A volume that clears your floor buys a phrase the right to be looked at properly, and that looking runs on evidence this number does not contain.
Use this chart — embed code and citation
<a href="https://neerajjivnani.com/blog/search-volume/"><img src="https://neerajjivnani.com/infographics/search-volume/it-rules-a-phrase-out-not-in.png" alt="A two column comparison of the two jobs a search volume gets asked to do. The left column, headed ruling out and described as the reliable half, reads that a phrase which returns nothing in Keyword Planner has demand below what the tool can see, or is a term Google declines to forecast, and closes on the line that this is not proof nobody searches and that for a planning decision the difference rarely matters. The right column, highlighted in orange and headed ruling in, states that it fails three ways at once and lists them: it is an estimate snapped to a ladder, so the figure is a rung rather than a count; it has been grouped with wordings you never asked about, so part of the total belongs to phrases that are not yours; and it describes demand rather than your share of it, so even a true total says nothing about your page. That column closes on the line that three estimates stacked on each other do not become a decision. A band across the foot reads that a volume which clears your floor buys a phrase the right to be looked at properly, and that the looking runs on evidence this number does not contain." width="1200"></a>
<p>Chart: <a href="https://neerajjivnani.com/blog/search-volume/">Neeraj Jivnani</a></p>Neeraj Jivnani, "What a Search Volume Number Counts, and What It Leaves Out", neerajjivnani.com, https://neerajjivnani.com/blog/search-volume/Free to republish with a link back to this page.
Four Things People Ask About the Figure
Four questions come up whenever somebody meets one of these figures and is not sure what to do with it.
Short answers, in the order they usually arrive.
How do you find a keyword's search volume? Keyword Planner inside a Google Ads account for Google's own averaged figure, a free bulk checker if you have a long list, or Google Trends if what you want is direction rather than a count.
What is meant by search volume? The estimated average number of monthly searches for a phrase, and for the wordings treated as close variants of it, in one country.
How do you see search volume on Google? In Keyword Planner, inside a Google Ads account, which is where Google's own averaged figure lives. Trends is public and free but hands you an index rather than a count, so there is no single official figure to look up.
Has Google search volume gone down? Neither free number can answer that. A keyword tool reports demand for one phrase, never Google's total. Trends divides interest by total searches, so a term growing slower than search overall draws a falling line while its raw count rises.
Decide the Question, Then Pick the Number
Most arguments about search volume are arguments about whose figure is right, and that is the wrong question. They count different things, and the two Google publishes document exactly how.
So decide what you are asking first.
- Comparing two phrases against each other wants the advertiser metric, read as an order of magnitude.
- Asking whether interest is rising wants the index, read as a direction.
- Asking what your own market looks like wants your impressions, which are the only real count you will ever see.
And when the answer would send you the same way whichever number you took, stop looking. A figure you cannot act on differently is not worth an afternoon of argument.