Site Speed Optimization: Which Fixes Are Actually Yours
Most speed advice is a list of twenty jobs. Two of them are yours. See how to find which, and which number Google actually reads.

/ On this page6 sections
You ran a test, got a number in a colored circle, and a list of twenty things to change.
Two or three of them are costing you almost all of the time. The rest will not move your page.
The job is telling those apart on your own page, then doing them in the order of how much each one removes.
There is also a second answer hiding in the same report, and it is the one Google reads.
Where the Seconds Actually Go
The seconds are almost never spread evenly across a page. They pile up in one or two places, and on most sites those places are the same two.
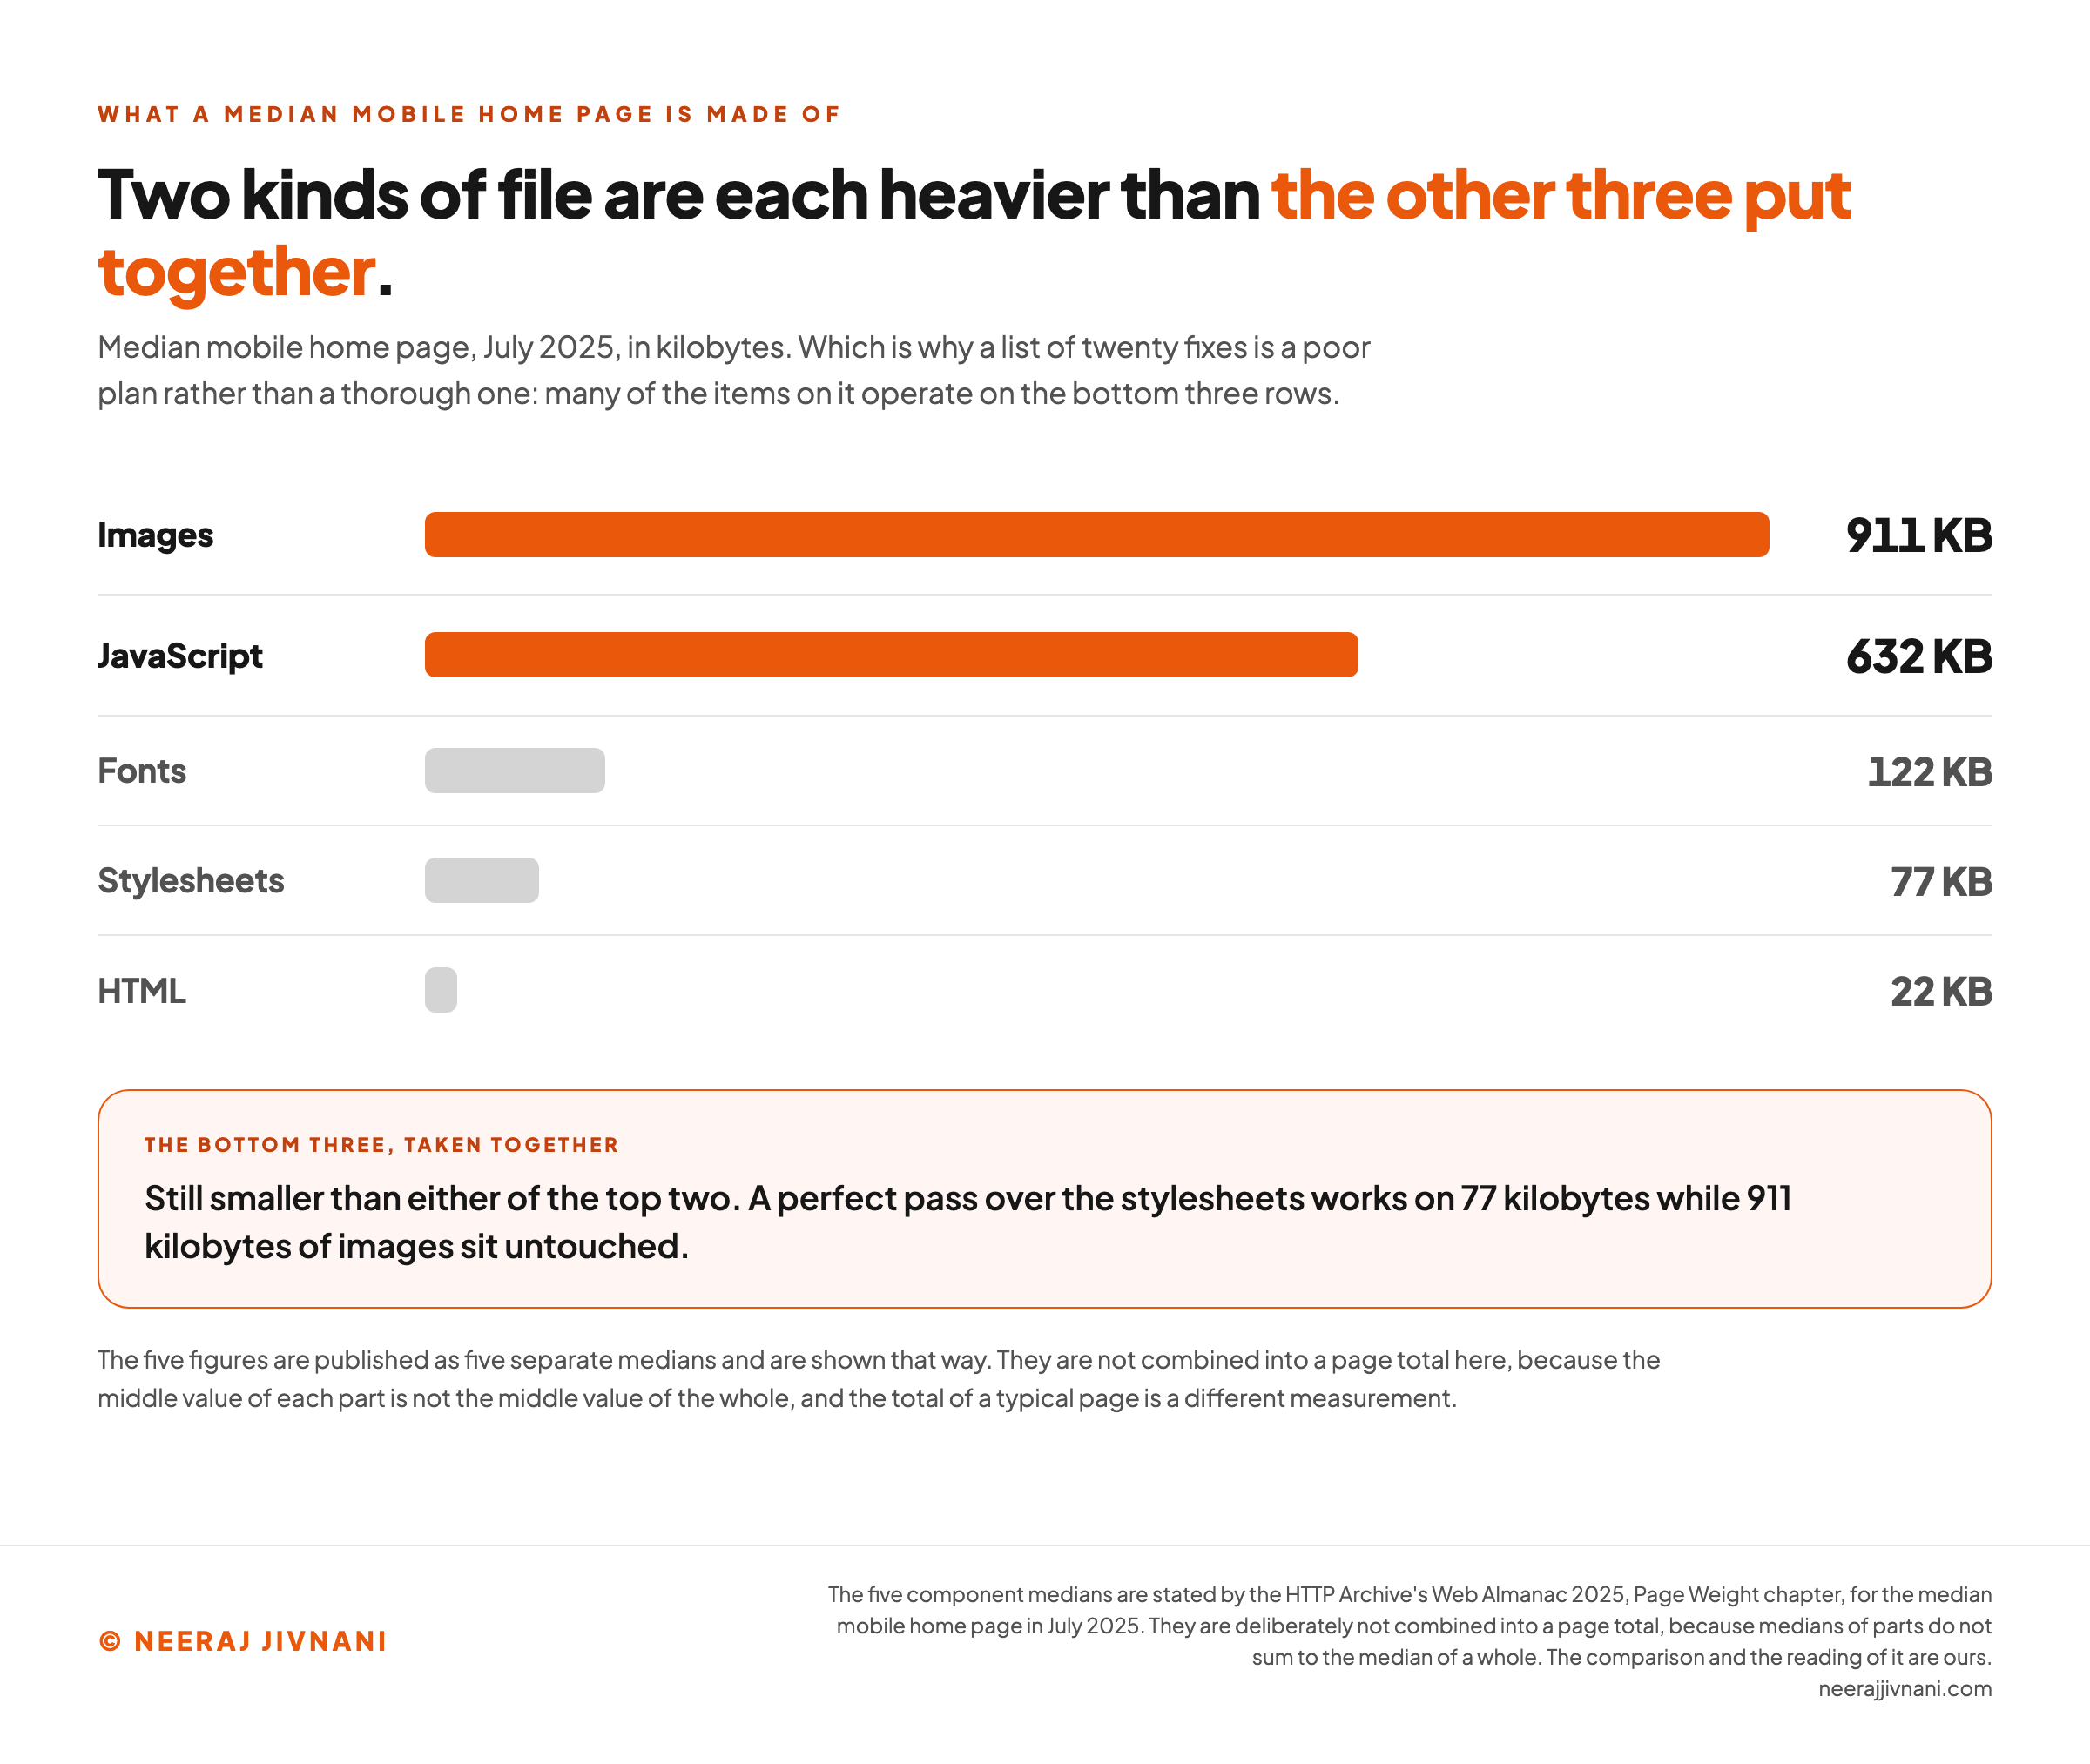
The 2025 Web Almanac's page weight chapter measured the median mobile home page at 911 kilobytes of images and 632 kilobytes of JavaScript. Fonts came to 122 kilobytes, stylesheets to 77, and the HTML itself to 22.
Each of the first two is larger than the other three put together.
That is why a list of twenty fixes is a poor plan rather than a thorough one. Many items on any such list operate on the small end of that spread, and you can do every one of them perfectly without a visitor noticing.
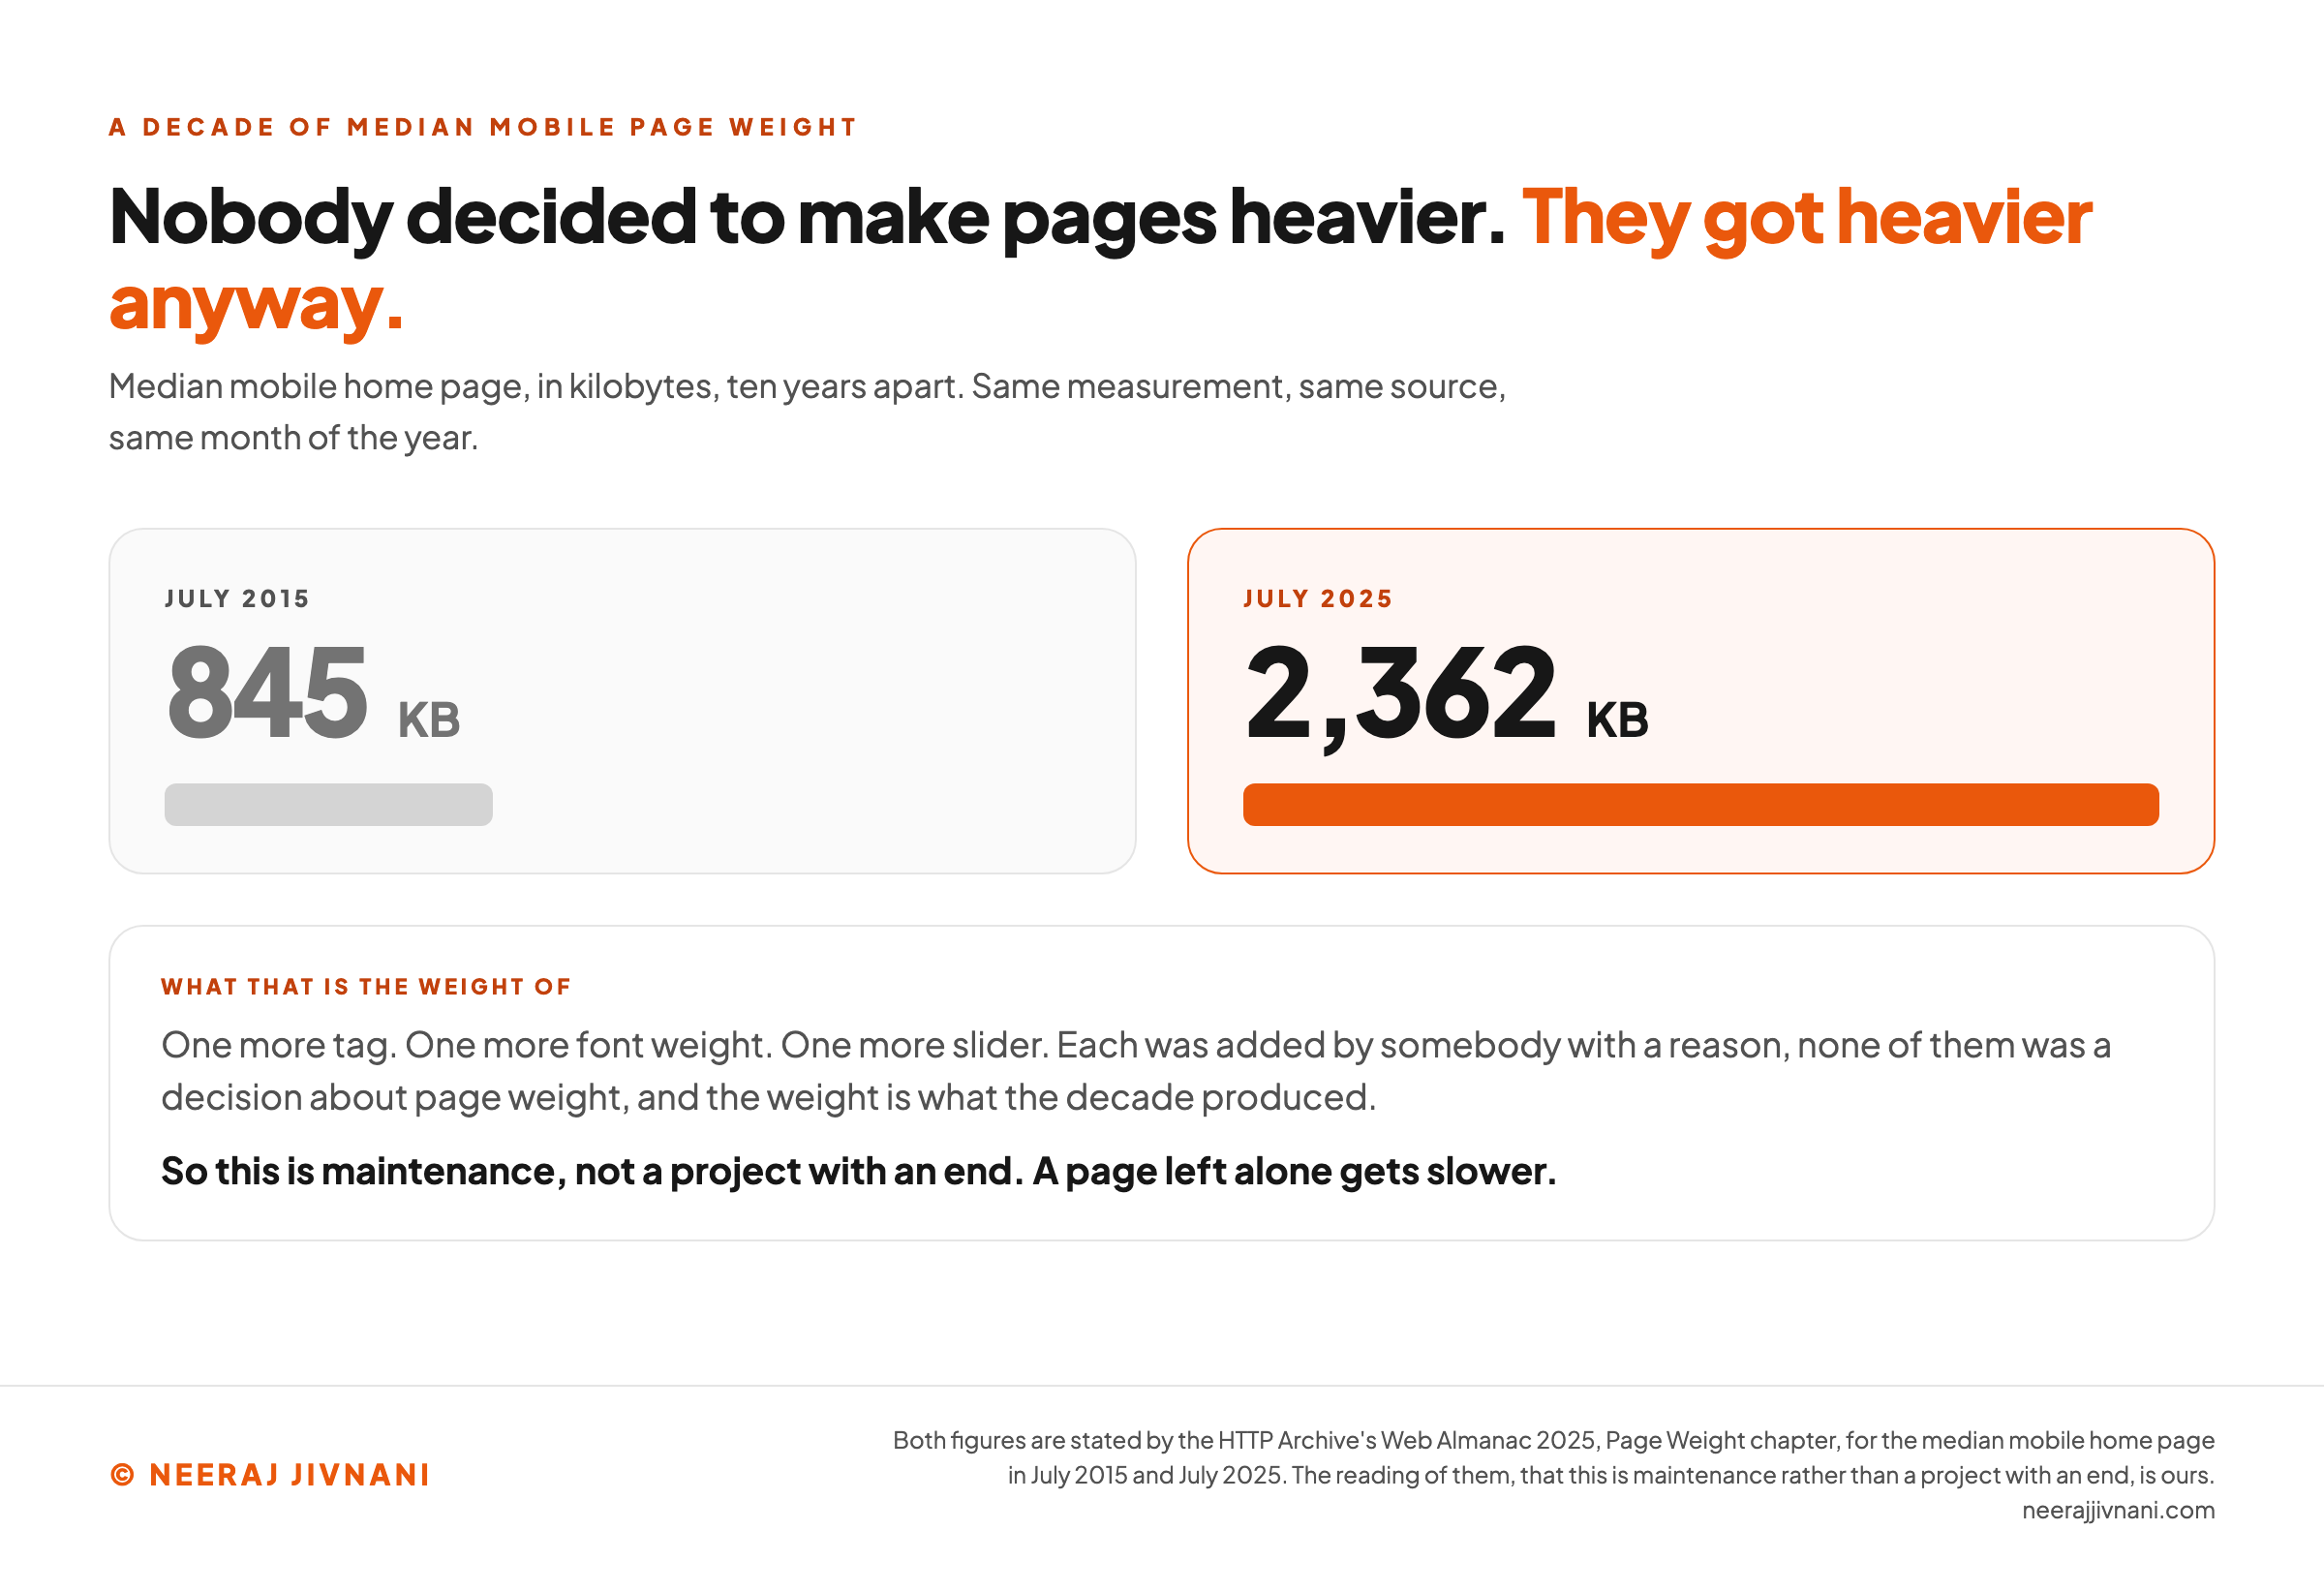
Pages also get heavier on their own, without anybody deciding to make them so.
The same chapter puts the median mobile home page at 845 kilobytes in July 2015 and 2,362 kilobytes in July 2025. That is what a decade of adding one more tag, one more font weight, one more slider looks like when you weigh it.
The first useful thing to know about this work is that it is maintenance, not a project with an end.
The Weight and the Work Are Two Different Costs
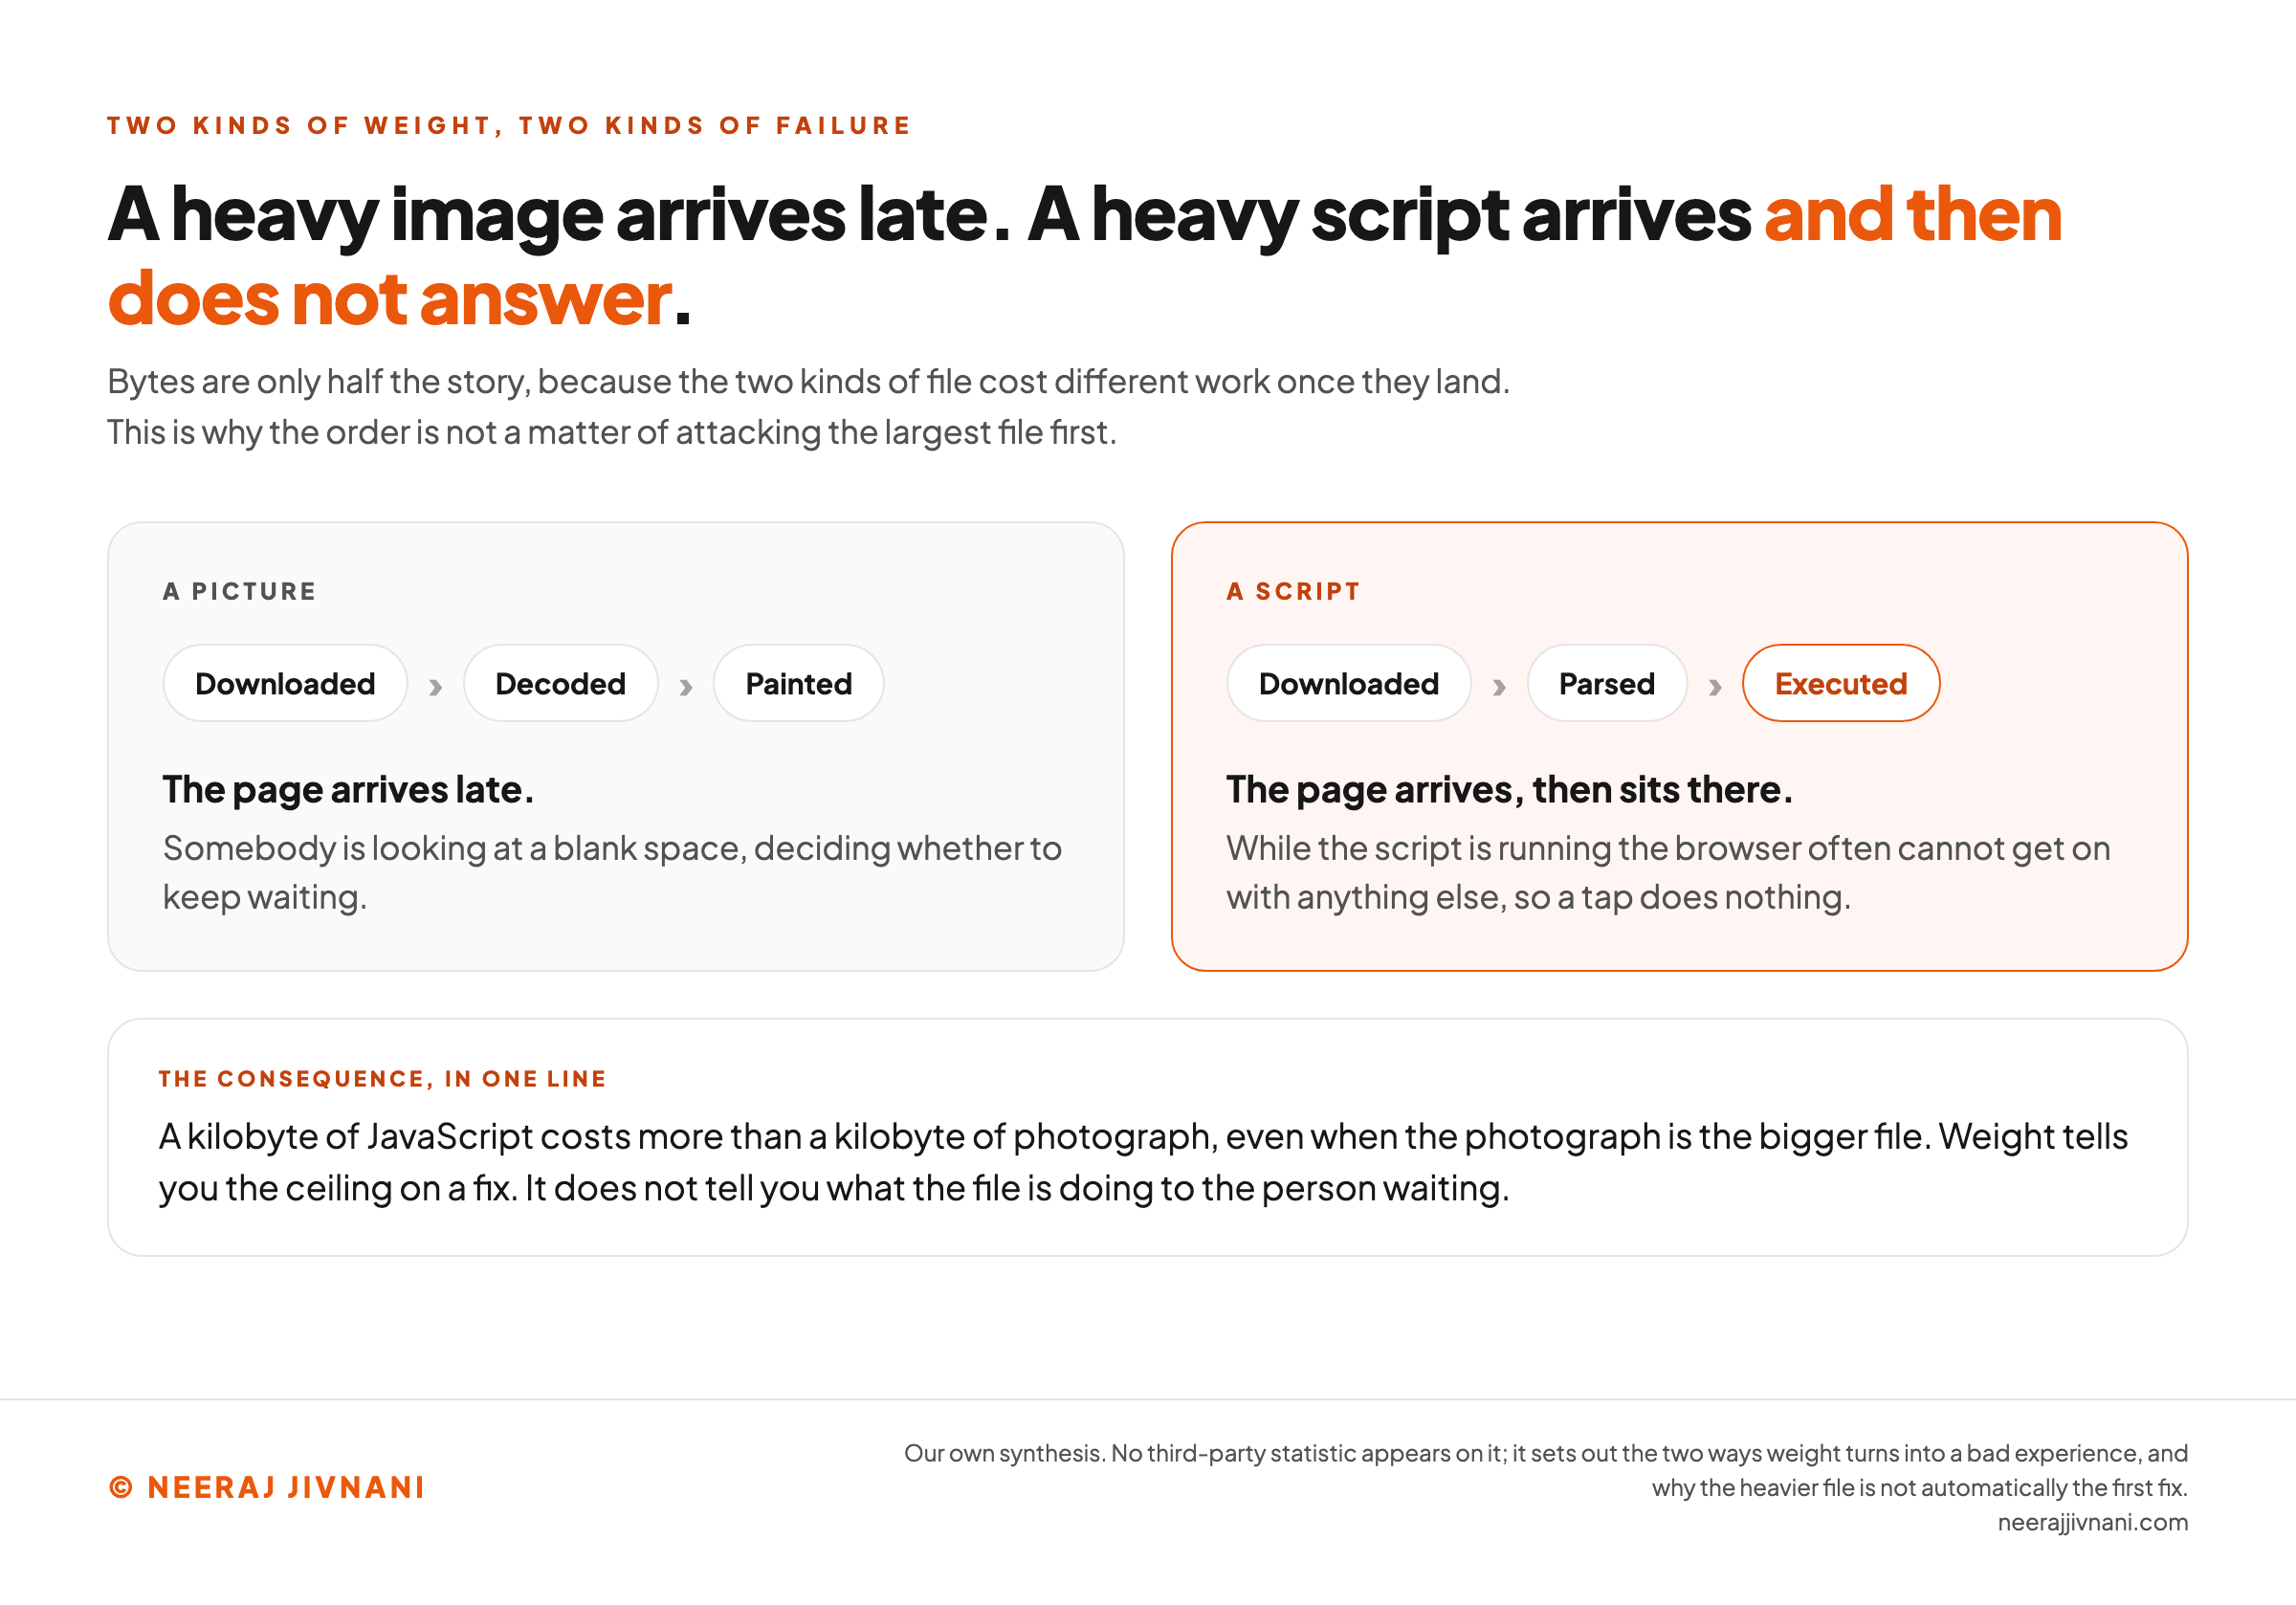
Bytes are only half the story.
A picture has to be downloaded, decoded and painted. A script has to be downloaded, parsed and executed, and while that is happening the browser often cannot get on with anything else.
So a kilobyte of JavaScript costs more than a kilobyte of photograph, even when the photograph is the bigger file.
The two also fail in different ways. A heavy image makes the page arrive late; heavy scripts make it arrive and then sit there, unresponsive to a tap, which is the worse experience of the two.
That is why the order below is not a matter of attacking the largest file first.
Use this chart — embed code and citation
<a href="https://neerajjivnani.com/blog/site-speed-optimization/"><img src="https://neerajjivnani.com/infographics/site-speed-optimization/two-kinds-carry-the-page.png" alt="A horizontal bar chart of what a median mobile home page is made of, headed that two kinds of file are each heavier than the other three put together. Five rows are shown in kilobytes for the median mobile home page in July 2025. Images lead at 911 kilobytes with the longest bar, JavaScript follows at 632 kilobytes, and the remaining three are drawn in grey as a visibly smaller group: fonts at 122 kilobytes, stylesheets at 77 kilobytes and HTML at 22 kilobytes. A line under the chart says that a list of twenty fixes is a poor plan rather than a thorough one, because many of the items on it operate on the bottom three rows. An orange panel headed the bottom three, taken together, says they are still smaller than either of the top two, and that a perfect pass over the stylesheets works on 77 kilobytes while 911 kilobytes of images sit untouched. A closing note says the five figures are published as five separate medians and are shown that way rather than combined into a page total, because the middle value of each part is not the middle value of the whole." width="1200"></a>
<p>Chart: <a href="https://neerajjivnani.com/blog/site-speed-optimization/">Neeraj Jivnani</a></p>Neeraj Jivnani, "Site Speed Optimization: Which Fixes Are Actually Yours", neerajjivnani.com, https://neerajjivnani.com/blog/site-speed-optimization/Free to republish with a link back to this page.
Use this chart — embed code and citation
<a href="https://neerajjivnani.com/blog/site-speed-optimization/"><img src="https://neerajjivnani.com/infographics/site-speed-optimization/nobody-added-this-weight-on-purpose.png" alt="A two-panel comparison of median mobile page weight ten years apart, headed that nobody decided to make pages heavier and they got heavier anyway. The left panel, in grey, is labeled July 2015 and reads 845 kilobytes above a short bar. The right panel, picked out in orange, is labeled July 2025 and reads 2,362 kilobytes above a bar running the full width of its panel. A line beneath says this is the median mobile home page in kilobytes, ten years apart, on the same measurement from the same source in the same month of the year. A panel underneath, headed what that is the weight of, says one more tag, one more font weight, one more slider, each added by somebody with a reason, none of them a decision about page weight, and the weight is what the decade produced. A closing line in bold says this is maintenance rather than a project with an end, and that a page left alone gets slower." width="1200"></a>
<p>Chart: <a href="https://neerajjivnani.com/blog/site-speed-optimization/">Neeraj Jivnani</a></p>Neeraj Jivnani, "Site Speed Optimization: Which Fixes Are Actually Yours", neerajjivnani.com, https://neerajjivnani.com/blog/site-speed-optimization/Free to republish with a link back to this page.
Use this chart — embed code and citation
<a href="https://neerajjivnani.com/blog/site-speed-optimization/"><img src="https://neerajjivnani.com/infographics/site-speed-optimization/late-or-unresponsive.png" alt="A two-card comparison of how a heavy picture and a heavy script fail differently, headed that a heavy image arrives late while a heavy script arrives and then does not answer. The left card, labeled a picture, shows three stages in sequence: downloaded, decoded, painted. Its verdict reads that the page arrives late, and that somebody is looking at a blank space deciding whether to keep waiting. The right card, picked out in orange and labeled a script, shows downloaded, parsed and executed, with executed highlighted. Its verdict reads that the page arrives and then sits there, because while the script is running the browser often cannot get on with anything else, so a tap does nothing. A panel underneath, headed the consequence in one line, says a kilobyte of JavaScript costs more than a kilobyte of photograph even when the photograph is the bigger file, and that weight tells you the ceiling on a fix rather than what the file is doing to the person waiting." width="1200"></a>
<p>Chart: <a href="https://neerajjivnani.com/blog/site-speed-optimization/">Neeraj Jivnani</a></p>Neeraj Jivnani, "Site Speed Optimization: Which Fixes Are Actually Yours", neerajjivnani.com, https://neerajjivnani.com/blog/site-speed-optimization/Free to republish with a link back to this page.
Measure Before You Change Anything
Measuring is not the formality you get through before the real work. It is most of the real work, because it is the only thing that tells you which two fixes are yours.
Run the page through PageSpeed Insights. It is free, it needs no account, and it reports what real visitors got alongside its own simulated run.
Two details about how you run it decide whether the answer is any use.
Test the page people land on rather than your homepage, because the homepage is often the only page anybody has ever optimized. And read the mobile tab, because the number from phones is the one that counts, and it is usually the worse of the two.
The Score Is Not the Measurement
The number in the circle is a simulation.
It is your page loaded once, on a throttled connection, on somebody else's hardware, scored on what happened. That is useful, and it is not the thing you are being judged on.
Google's documentation for the tool draws the line itself. Lab data is "useful for debugging issues" but "may not capture real-world bottlenecks", while field data captures "true, real-world user experience" with a more limited set of metrics.
The two numbers answer different questions, and neither of them outranks the other.
The score points at what to look at, because it lists the specific files and the milliseconds they cost. The field section tells you whether any of it matters to the people on your site.
Two pages with the same score routinely have different field results. Your visitors are not the test machine, and the gap between them is the whole point of collecting both.
Your Number Is Four Weeks Behind You
The field section moves slowly, and that is the detail that wastes the most afternoons.
PageSpeed Insights reports real users' experiences "over the previous 28-day collection period". It is a trailing four-week window, not a live reading.
So you compress the hero image, reload the report, and the field numbers have not moved. Nothing is broken.
You are looking at a month that mostly happened before the fix.
The practical version is short. Make the change, write down the date, and come back in a month.
In between, the score is the only thing that will react, and it is reacting to a simulation.
When the Report Has No Real Visitors In It
Sometimes the field section is missing altogether, and sometimes it describes a page you did not test.
The same documentation explains both. A page needs enough samples to appear at all, and when it has too few the tool "will fall back to origin-level granularity, which encompasses all user experiences on all pages of the website".
So a quiet page shows you your whole site's numbers, averaged across the busy pages and the dead ones. If the site itself is quiet, there is no field data at all.
For a small site, that is the normal state rather than a fault.
A blank panel does not mean the page is fine, and it does not mean it is beyond help. It means too few people have visited for the report to say anything.
What you do instead is judge on the two signals you still have. Fix the weight the score points at, then open the page on your own phone, on a connection that is not your office network.
The Fixes, in the Order That Moves the Number
The fixes below are ordered by how much each one removes, heaviest first. Where two are close in weight the scripts go first, because the browser has to run them as well as fetch them.
A report lists what it can detect, and detecting a shortened stylesheet is easier than detecting a photograph that did not need to be there. So the small wins float to the top and the large ones sit underneath them, unranked.
Work down the list below instead, and stop when the page is fast enough. If your page is shaped like the median, the first two are where the weight is and everything after them works on what is left.
The ceiling on each fix
A fix cannot remove more than the thing it works on weighs. Put the weight of your own page in, by kind, and every suggestion you were handed comes back with the most it could ever take off. Nothing here is kept or sent anywhere.
Open the network panel in your browser's developer tools, load the page people actually land on, and read the weight of each kind. Kilobytes, rounded, is close enough.
A list of twenty suggestions is ranked by nothing until your own page ranks it.
Start With the One Image
Find the biggest thing a visitor sees first. On most pages it is a photograph, and it is usually being served several times larger than it is displayed.
Three changes, in this order.
- Resize it to the dimensions it is shown at.
- Save it as WebP or AVIF.
- Serve a smaller file to phones than to desktops.
A four-megabyte camera file can become a couple of hundred kilobytes with no visible difference.
There is one trap to avoid before you start deferring things.
Holding back offscreen images until somebody scrolls to them, which is called lazy loading, is a genuine saving. The image at the top of the page is the exception, because it is the one being timed.
Largest Contentful Paint, Google's measure of when the biggest element in view arrives, has 2.5 seconds to work in. Making it wait behind a lazy loader spends that budget on nothing.
Then the Scripts You Did Not Write
The heaviest code on most sites was not written by anybody who works there.
Chat widgets, analytics, heatmaps, consent banners, social embeds, a plugin installed for a campaign that ended two years ago. Each arrives from somebody else's server, and each runs while your page is trying to finish.
Open the network panel in your browser's developer tools, sort by size, and read the domain column.
Anything that is not your domain is a decision somebody made once and nobody has revisited since.
Ask two questions of each one. Has anybody looked at what it produces in the last year, and does the page work without it?
Delete what fails both. Load what survives after the page has rendered rather than before it.
Video embeds deserve a separate look, because a player can weigh more than everything else on the page combined. Showing a thumbnail and fetching the player only when somebody clicks costs nothing a visitor would notice.
Fonts Are Small and Expensive
Font files are a rounding error by weight and can still be the thing you see going wrong.
Text cannot be painted in a font that has not arrived yet. Until it does, the browser either shows nothing or shows a fallback and swaps later, which moves the layout under somebody's thumb.
Two decisions fix most of it.
Ship fewer weights, and tell the browser to show the fallback immediately rather than wait for the real thing. A family loaded at five weights is five downloads, and a page that uses two of them has paid for three it never shows.
Caching and a Delivery Network Move Distance, Not Weight
Both are worth having. Neither is a weight-loss plan, and treating one as a substitute for the work above is how a slow page stays slow on better infrastructure.
A browser cache means a returning visitor does not download what has not changed since last time. It does nothing at all for a first visit, which is the one a stranger gets.
A content delivery network, or CDN, keeps copies of your files on servers near your visitors, so each request travels a shorter way.
The file is exactly the same size when it arrives.
Use both, and expect neither to rescue a page that is four megabytes of photographs.
The Half of It That Is the Server
Everything above concerns what the browser downloads. There is a period before any of that begins, and on some sites it is where the seconds are.
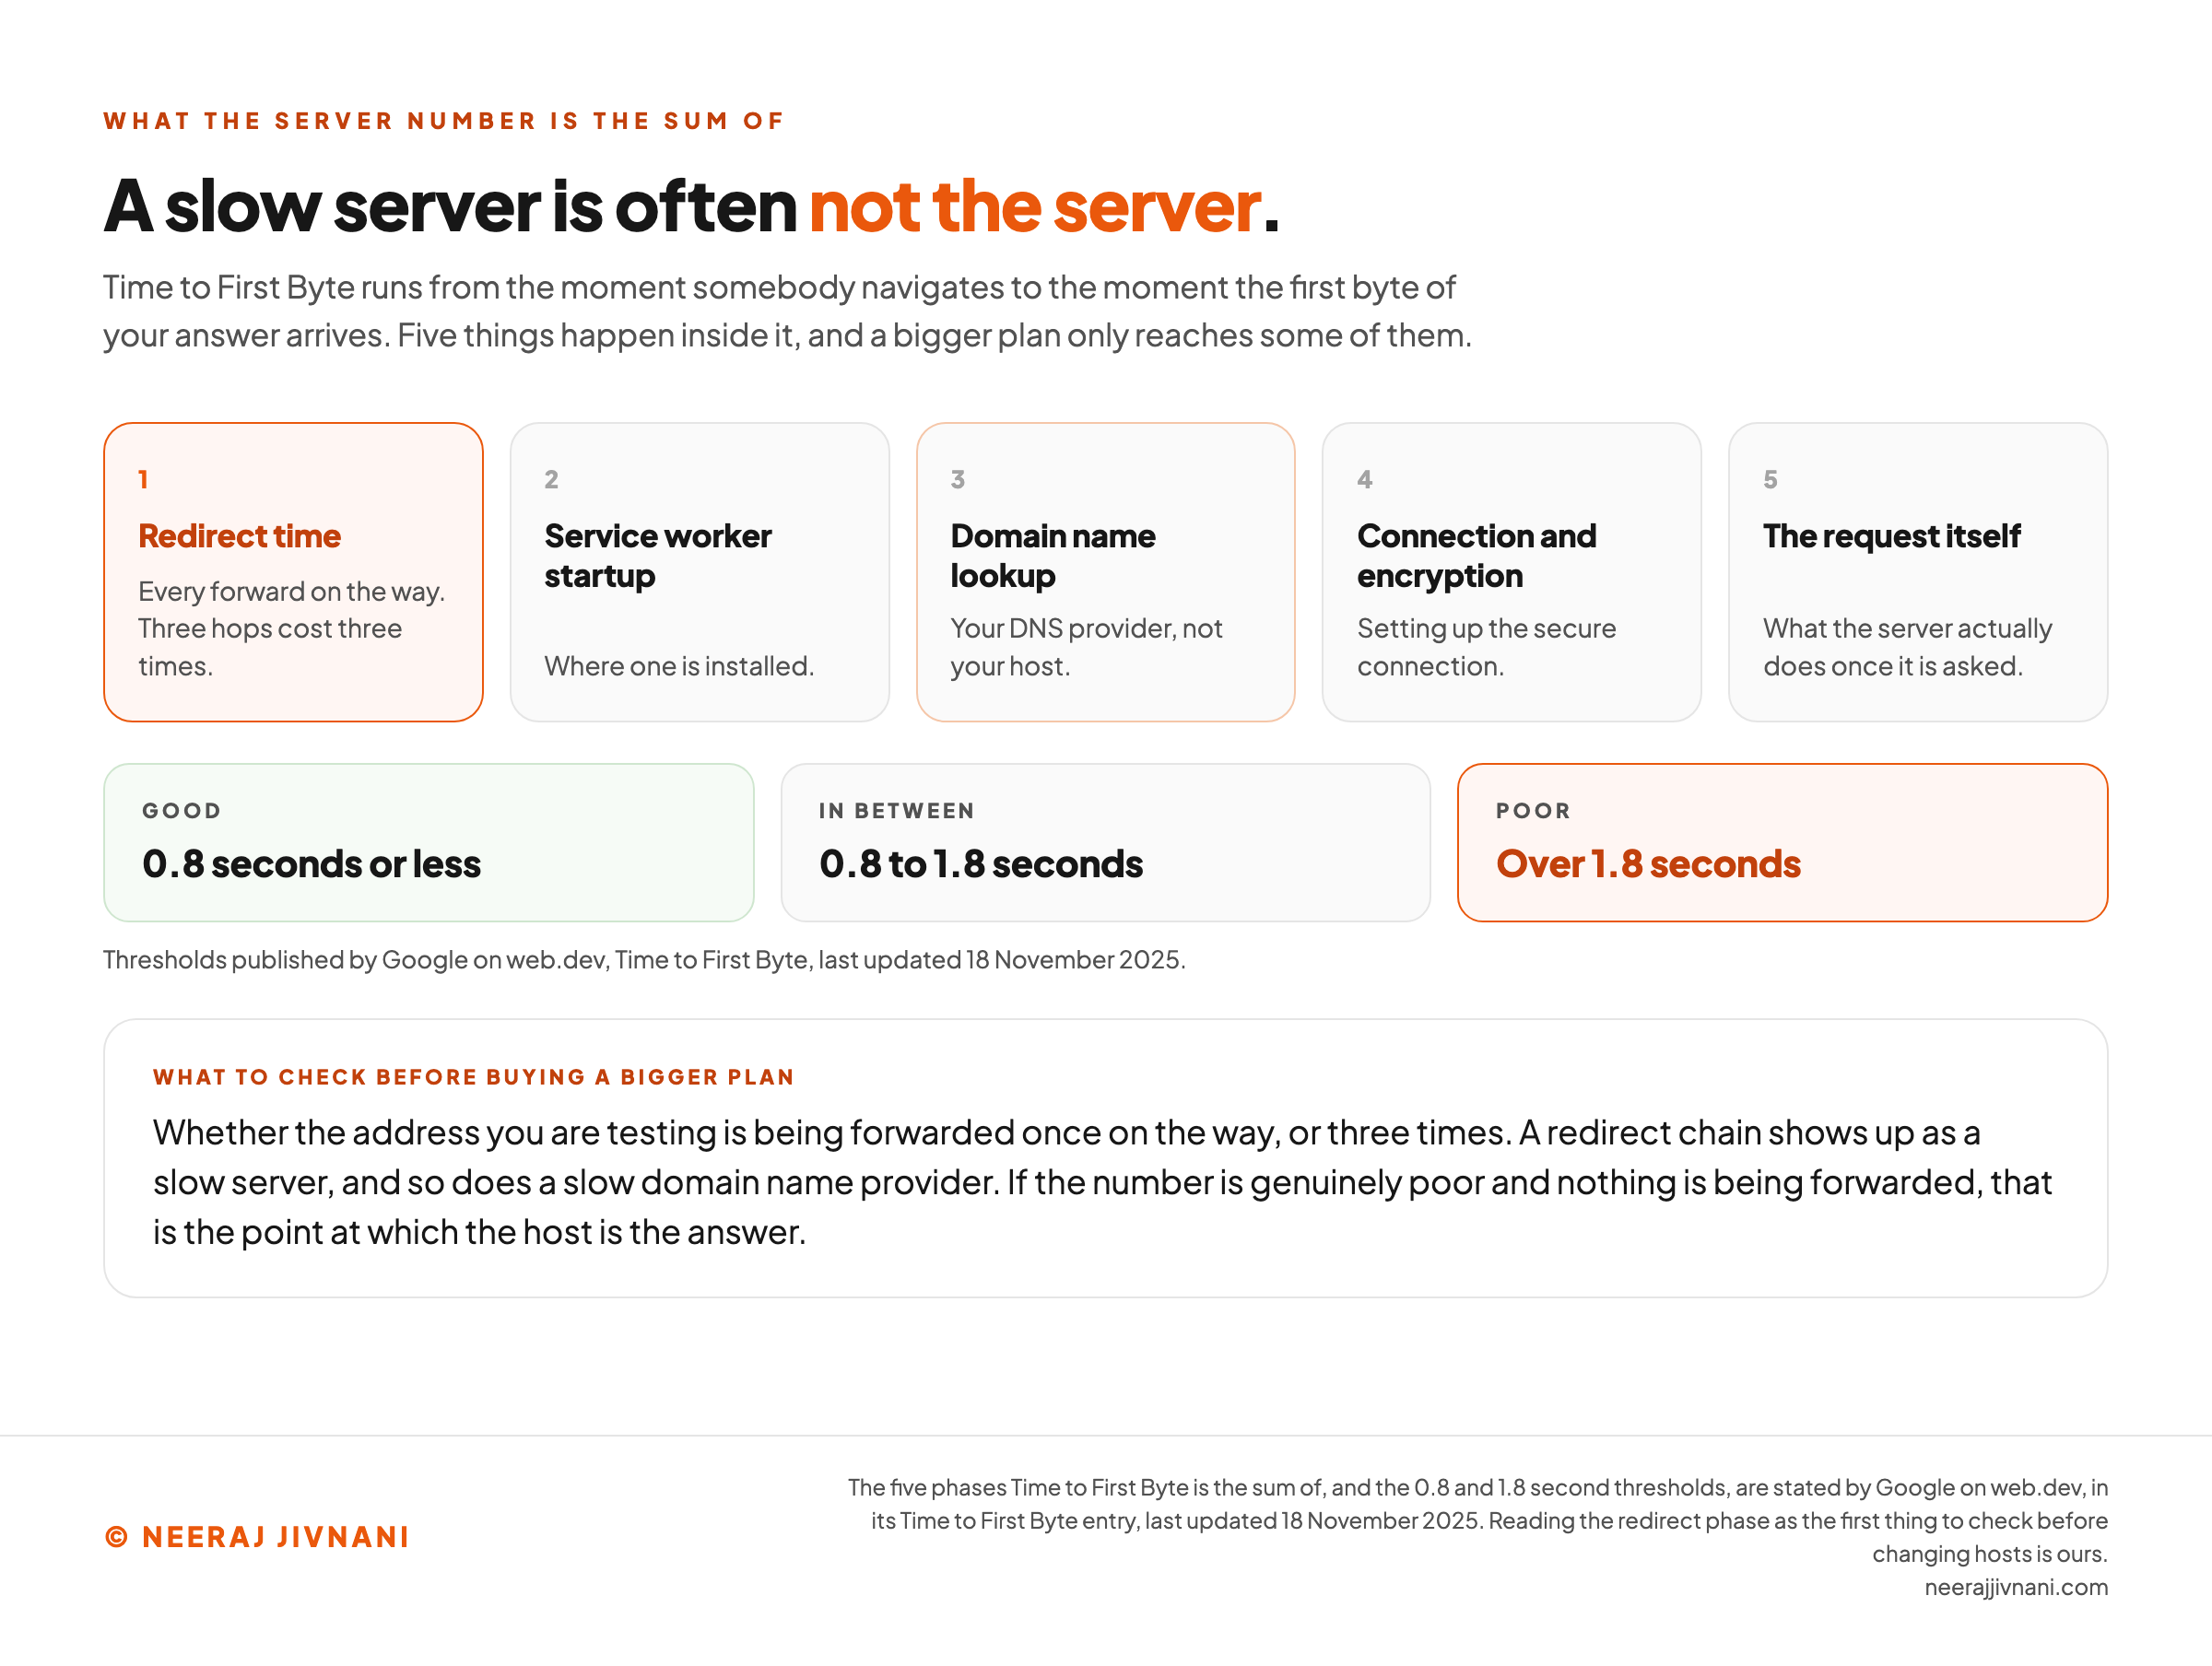
Time to First Byte measures from the moment somebody navigates to the moment the first byte of your answer arrives. Google's entry on the metric, updated in November 2025, puts a good value at 0.8 seconds or less and a poor one above 1.8 seconds.
The useful part is what that number contains.
The same entry describes it as the sum of redirect time, service worker startup, the domain name lookup, connection and encryption setup, and the request itself.
So a redirect chain shows up as a slow server, and so does a slow domain name provider. Before upgrading a hosting plan, check whether the address you are testing is being forwarded once on the way, or three times.
If the number is genuinely poor and nothing is being forwarded, that is the point at which the host is the answer and a better plan earns its money.
One qualifier, from the same entry. This measurement is not one of the Core Web Vitals, and Google says sites need not meet its threshold as long as it is not holding back the metrics that do count.
Minification and Request Counts Come Last
Stripping whitespace from stylesheets and scripts is real work with a measurable result. Compressing text before it is sent works too, and your host has probably done it for you already.
Combining files to make fewer requests mattered more on older connection protocols than it does today.
All of it belongs at the end of the list. Not because it is fake, but because it operates on the smallest part of the page.
On a page shaped like the median, a perfect minification pass works on the 77 kilobytes of stylesheets while the 911 kilobytes of images sit untouched.
Use this chart — embed code and citation
<a href="https://neerajjivnani.com/blog/site-speed-optimization/"><img src="https://neerajjivnani.com/infographics/site-speed-optimization/a-slow-server-is-often-a-redirect.png" alt="A five-step diagram of what Time to First Byte is the sum of, headed that a slow server is often not the server. A line beneath says the measurement runs from the moment somebody navigates to the moment the first byte of the answer arrives, that five things happen inside it, and that a bigger plan only reaches some of them. The five numbered cards read: redirect time, picked out in orange, with the note that every forward on the way counts and three hops cost three times; service worker startup, where one is installed; domain name lookup, which is the DNS provider rather than the host; connection and encryption, setting up the secure connection; and the request itself, which is what the server actually does once it is asked. Below them three bands show the published thresholds: good at 0.8 seconds or less, in between at 0.8 to 1.8 seconds, and poor at over 1.8 seconds, credited to Google on web.dev, Time to First Byte, last updated 18 November 2025. A closing panel, headed what to check before buying a bigger plan, asks whether the address being tested is forwarded once on the way or three times, notes that a redirect chain and a slow domain name provider both show up as a slow server, and says that if the number is genuinely poor and nothing is being forwarded, that is the point at which the host is the answer." width="1200"></a>
<p>Chart: <a href="https://neerajjivnani.com/blog/site-speed-optimization/">Neeraj Jivnani</a></p>Neeraj Jivnani, "Site Speed Optimization: Which Fixes Are Actually Yours", neerajjivnani.com, https://neerajjivnani.com/blog/site-speed-optimization/Free to republish with a link back to this page.
What Speed Does, and Does Not Do, for Rankings
Speed will not win you a search you were going to lose. It settles the ones where the answers are close.
Google collects these measurements from real Chrome visitors, in a dataset it calls the Chrome User Experience Report, and uses them to inform page experience in search.
Which means the number that matters to search is the slow one. Not the score you can move this afternoon, but the four-week record of what people got.
The better reason to do the work does not involve a search engine at all. Somebody who waits is deciding whether to keep waiting, and every fix above buys back part of that decision.
Rankings are the second-order benefit. Treat them that way and you will make better calls about when to stop.
Questions People Ask About Site Speed Optimization
Four questions, answered in a sentence or two each.
What Are Ways to Increase Your Site Speed?
In the order that usually pays: re-encode and resize the largest image, remove or defer third-party scripts nobody is using, and cut unused font weights.
After those, put a cache and a delivery network in front of static files, and check that a redirect is not sitting in front of the address. Minification and request counts come last.
How Do You Measure Site Speed?
Run the page through PageSpeed Insights on its mobile tab.
Read the field section, which comes from real visitors, before the score, which comes from one simulated load. If there is no field section at all, the page has too few visitors to report on, and the simulation is all you have.
Is Site Speed Important for SEO?
Yes, and less than the attention it gets.
What real Chrome visitors experienced feeds Google's page experience signals, so it is a genuine input. It settles close calls rather than substituting for being the better answer, and no amount of speed rescues a page that answers the question badly.
How Do You Reduce Website Loading Time?
Weigh the page before you change it.
Images and JavaScript are the two heaviest kinds of file on a typical page, so the two largest reductions available to most sites are a smaller lead image and one fewer third-party script.
Everything else is smaller than those two, and several of the usual suggestions are smaller by an order of magnitude.
What to Change This Week, and When to Stop
Two changes this week will do more than the other eighteen on the list, and both fit in an afternoon.
Open the page people land on, in PageSpeed Insights, on mobile. Write down the field numbers and today's date.
Then re-encode the largest image, and remove one third-party script you cannot justify.
Come back in four weeks, because that is how long the measurement takes to catch up with you.
Stop when real visitors are inside the published thresholds. Nothing is waiting above that line, and the effort per tenth of a second climbs steeply once the obvious weight is gone.
A page that finishes before somebody gets impatient has done its job, and the rest of the list can stay undone.